
Maps and Layer Glossary
| Layer Type | Description | Layer Preview Image |
|---|---|---|
| Point / Scatter Layer | Draws points for events or objects based on latitude and longitude, optionally sized or colored by attribute. Useful for store locations, sensors, incidents, and customer addresses. | 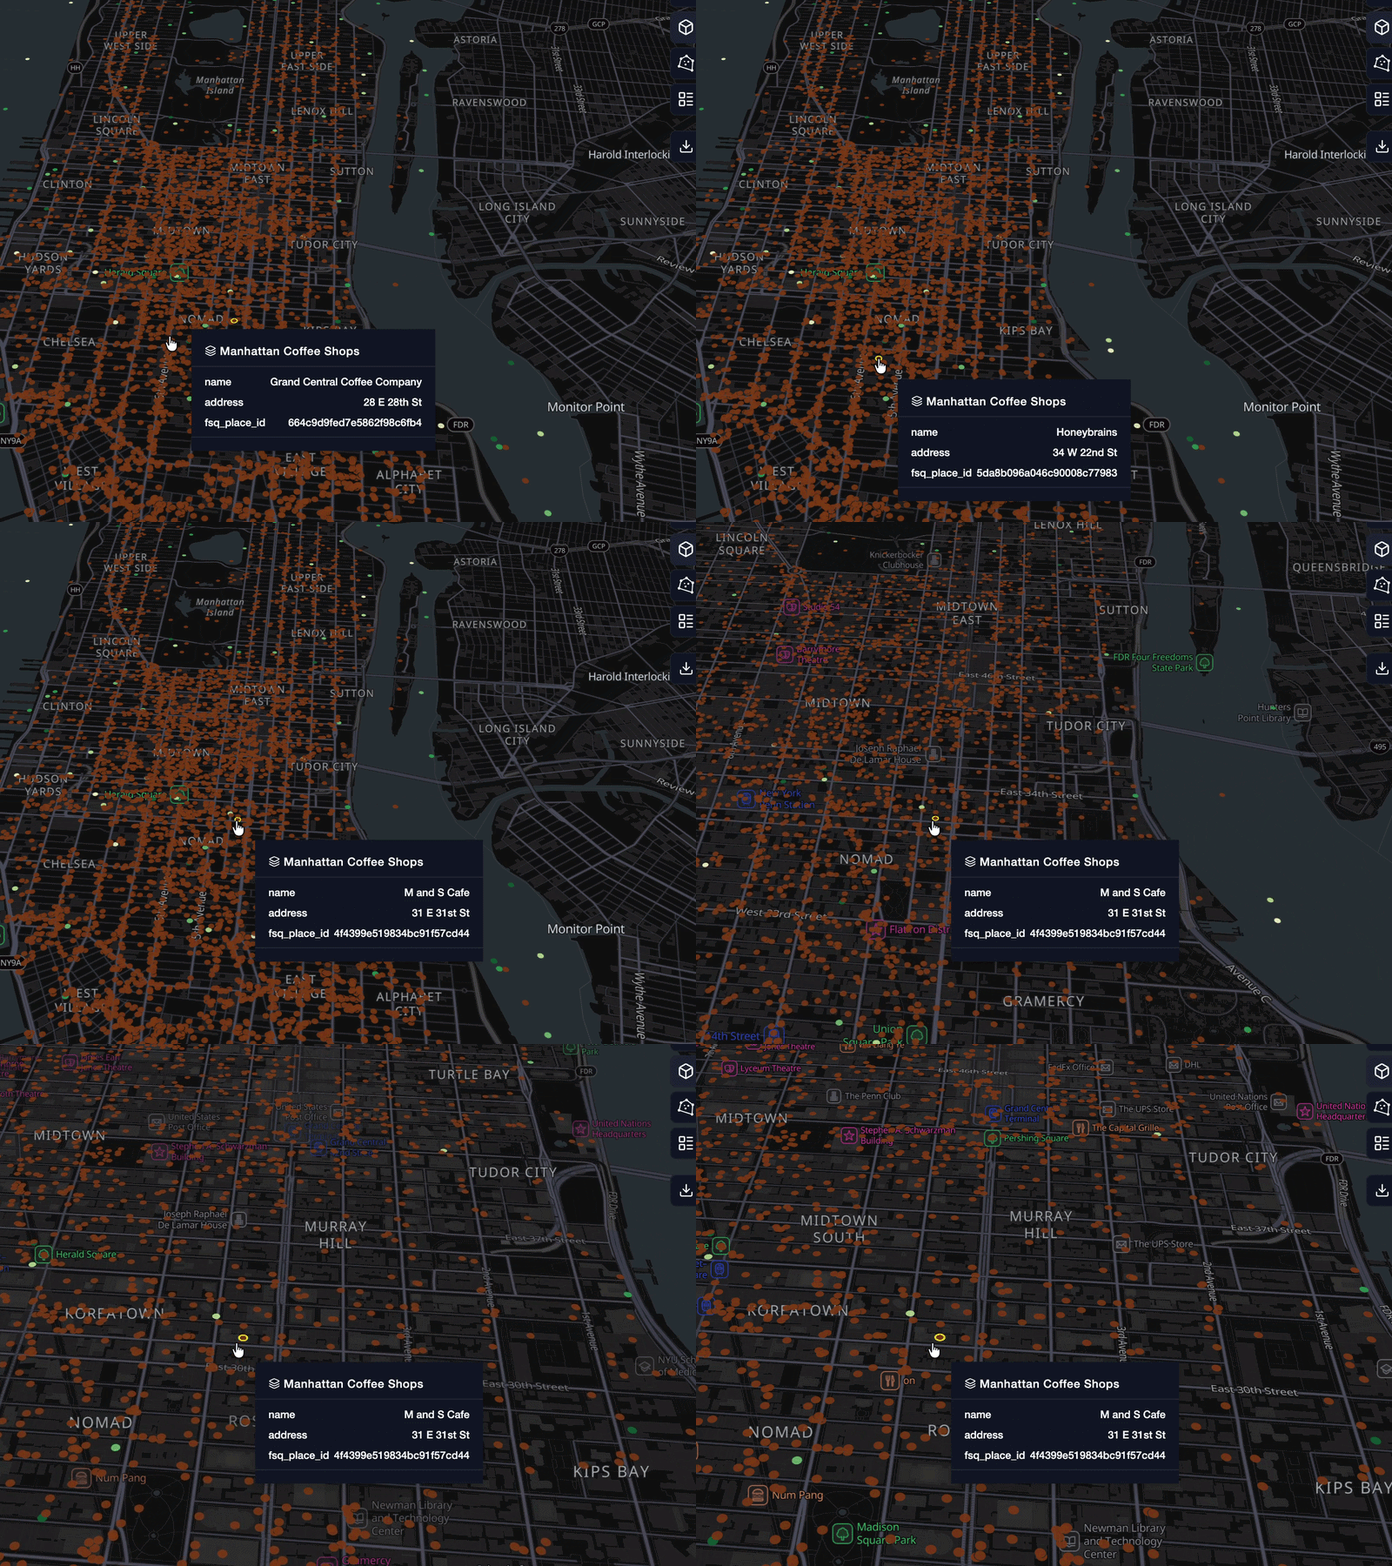 |
| Polygon Layer | Fills area with 2D/3D geometries with solid colors or data-driven values (choropleth). Useful for administrative boundaries, parcels, census tracts, and sales territories | 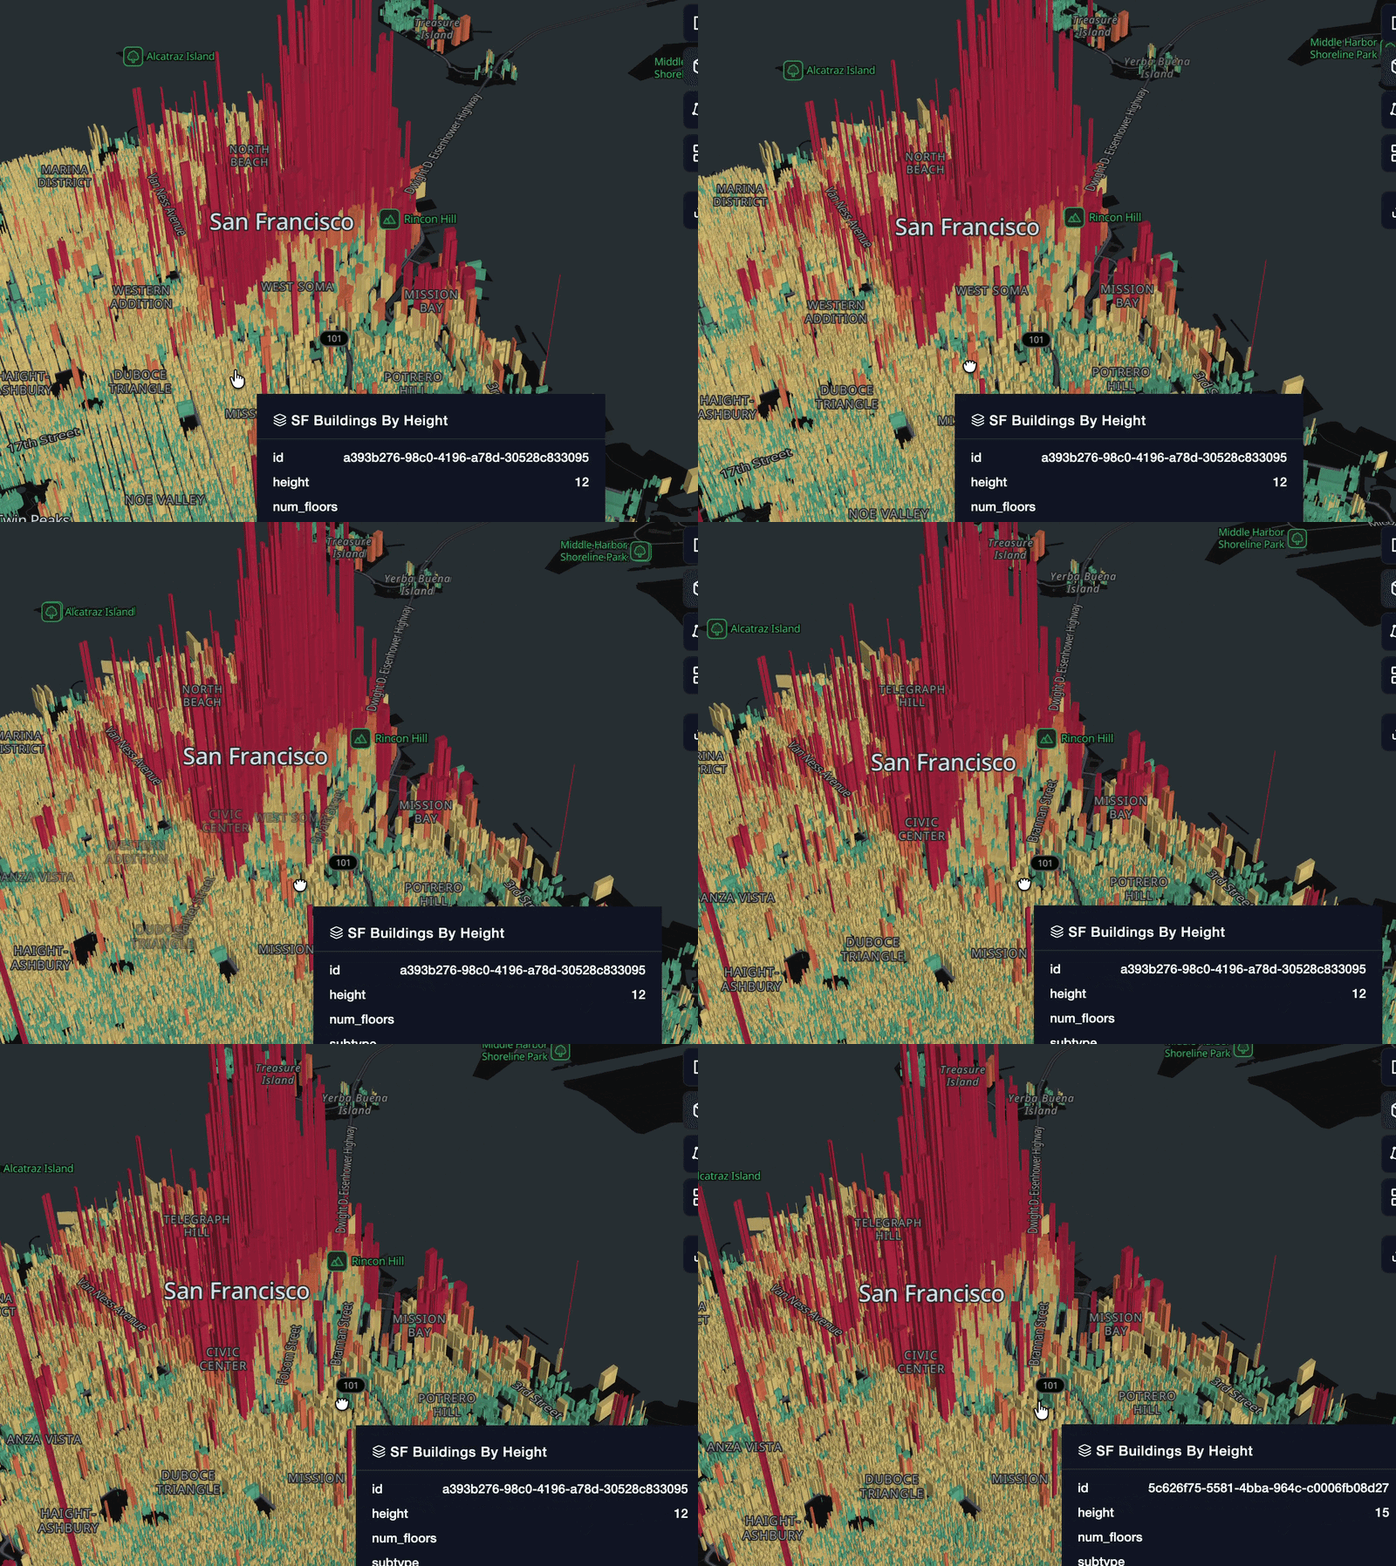 |
| 3D Layer | Extrudes polygons vertically with height driven by a data attribute. Useful for building skylines, 3D population density, and economic indicators. | |
| Arc | Draws curved lines between origin-destination pairs, useful for visualizing distance and flow volume in 3D. Useful for commuting patterns, migration, and trade routes. | 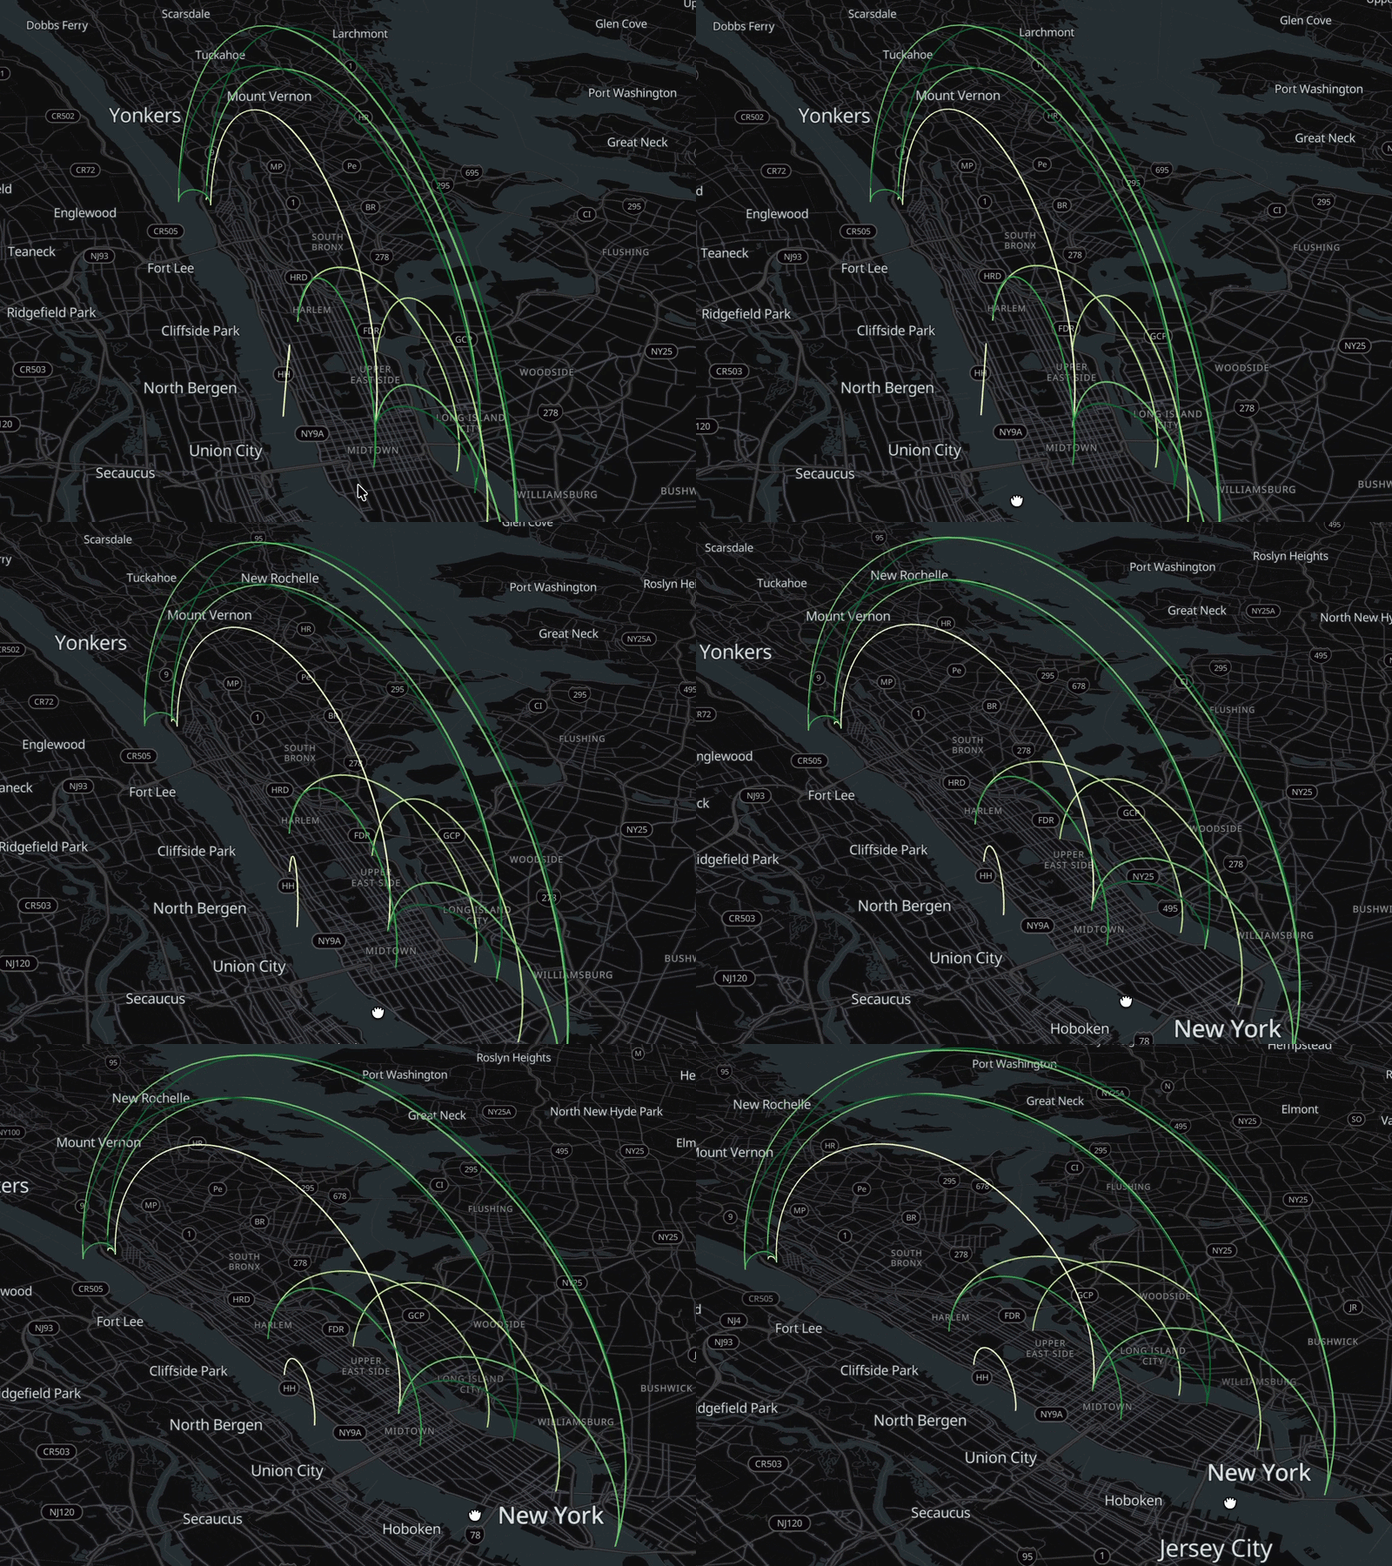 |
| Cluster layer | Groups nearby points into aggregated markers at low zoom and expands to individual points on zoom-in. Useful for large point datasets like stores, listings, or social posts. | 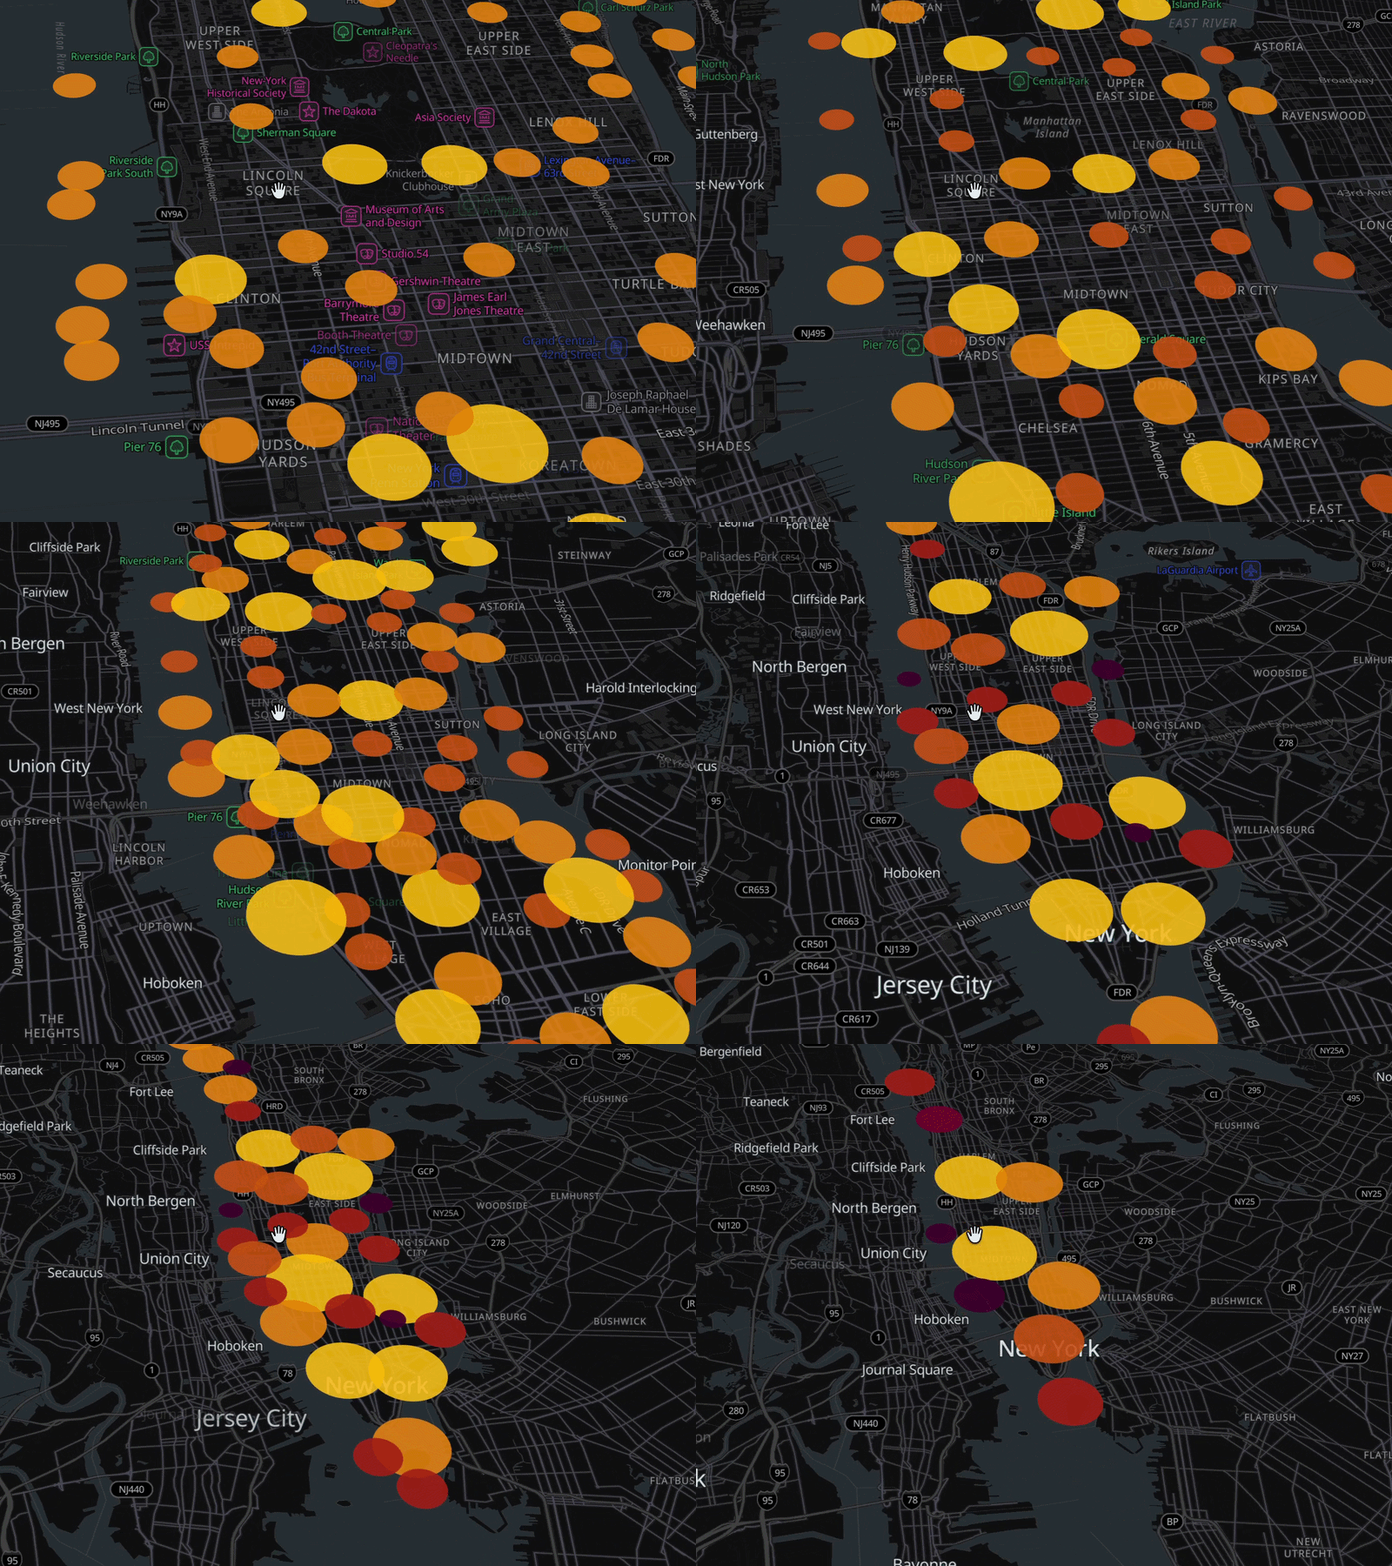 |
| Heatmap Layer | Graphical representation of data where density values are rendered as a continuous color surface. Useful for spotting hotspots in crime, foot traffic, or pollution data. | 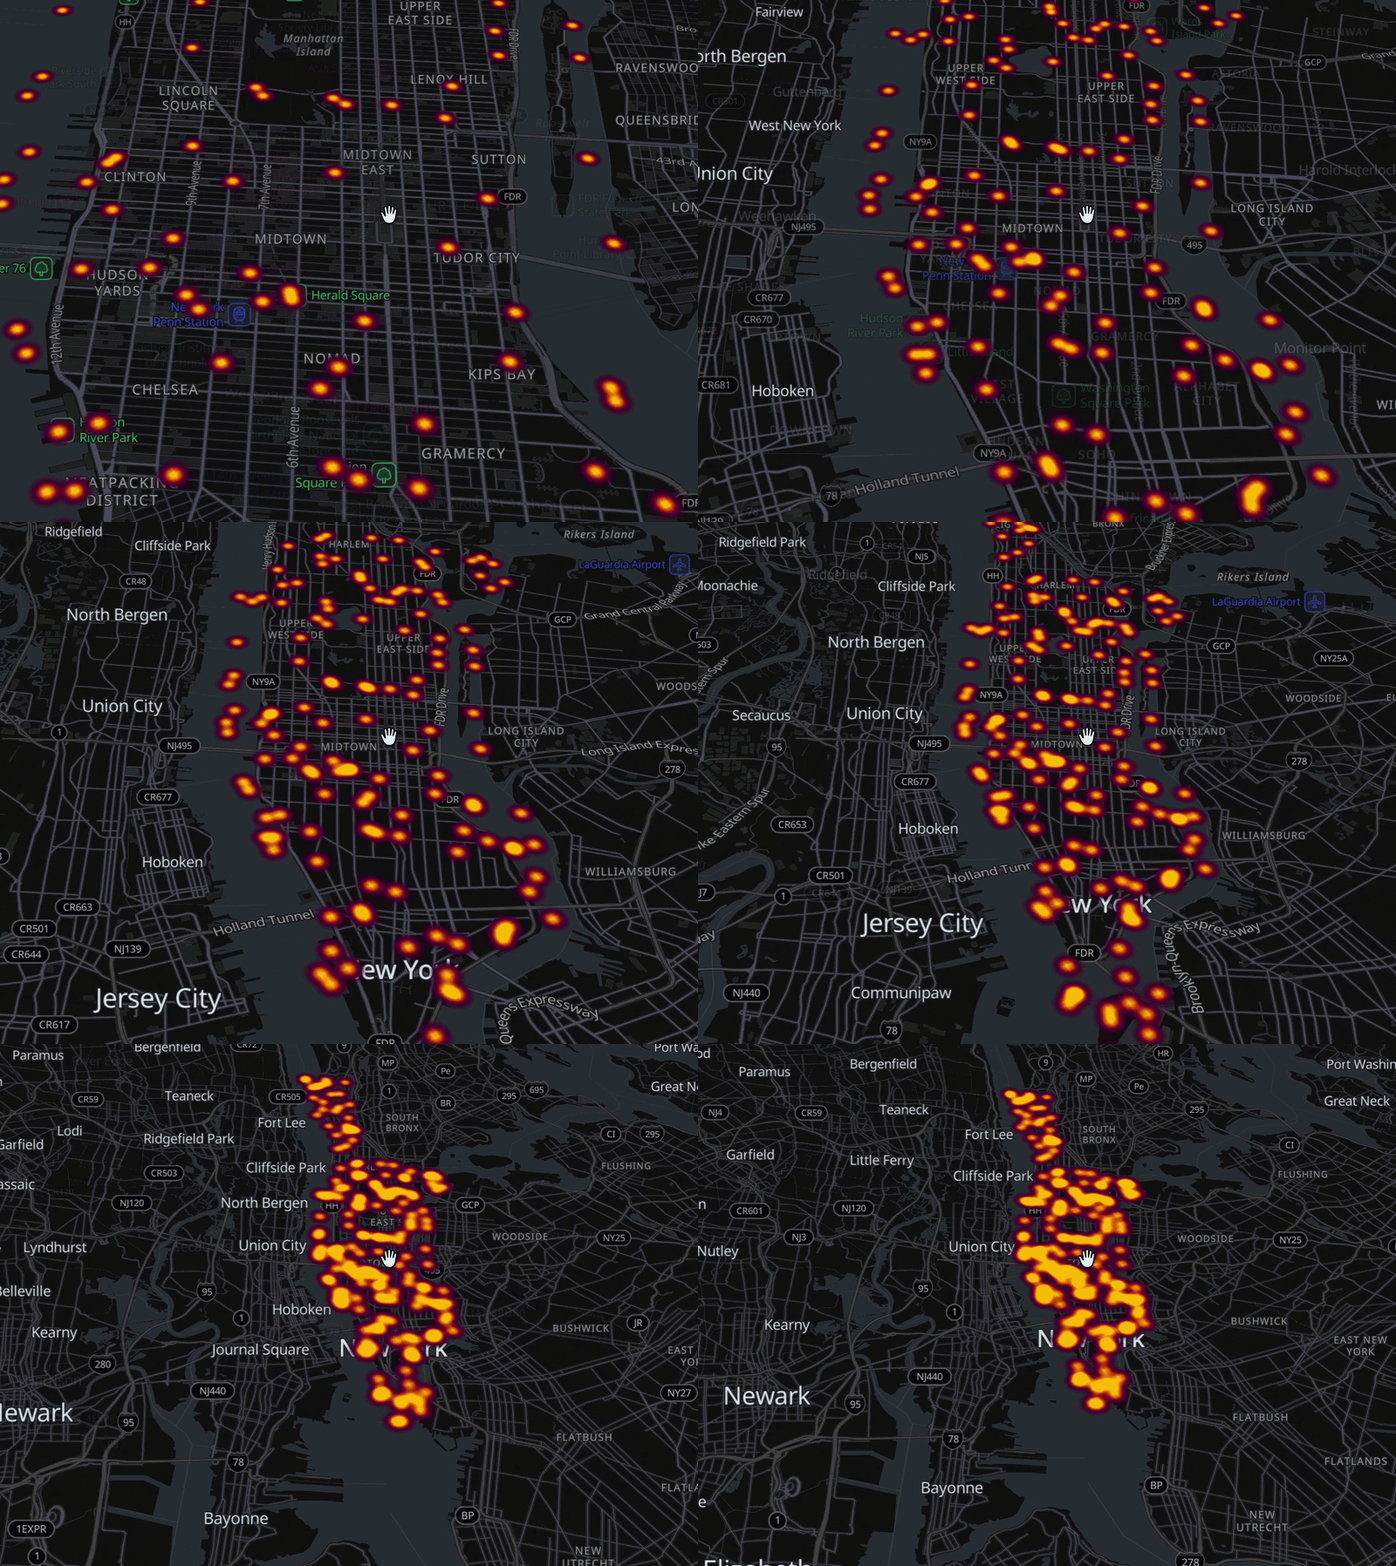 |
Updated about 11 hours ago
Did this page help you?