
Heatmap Layer
Heatmap layers describe the intensity of data at geographical points through a colored overlap. The intensity can be weighted by a numerical field.
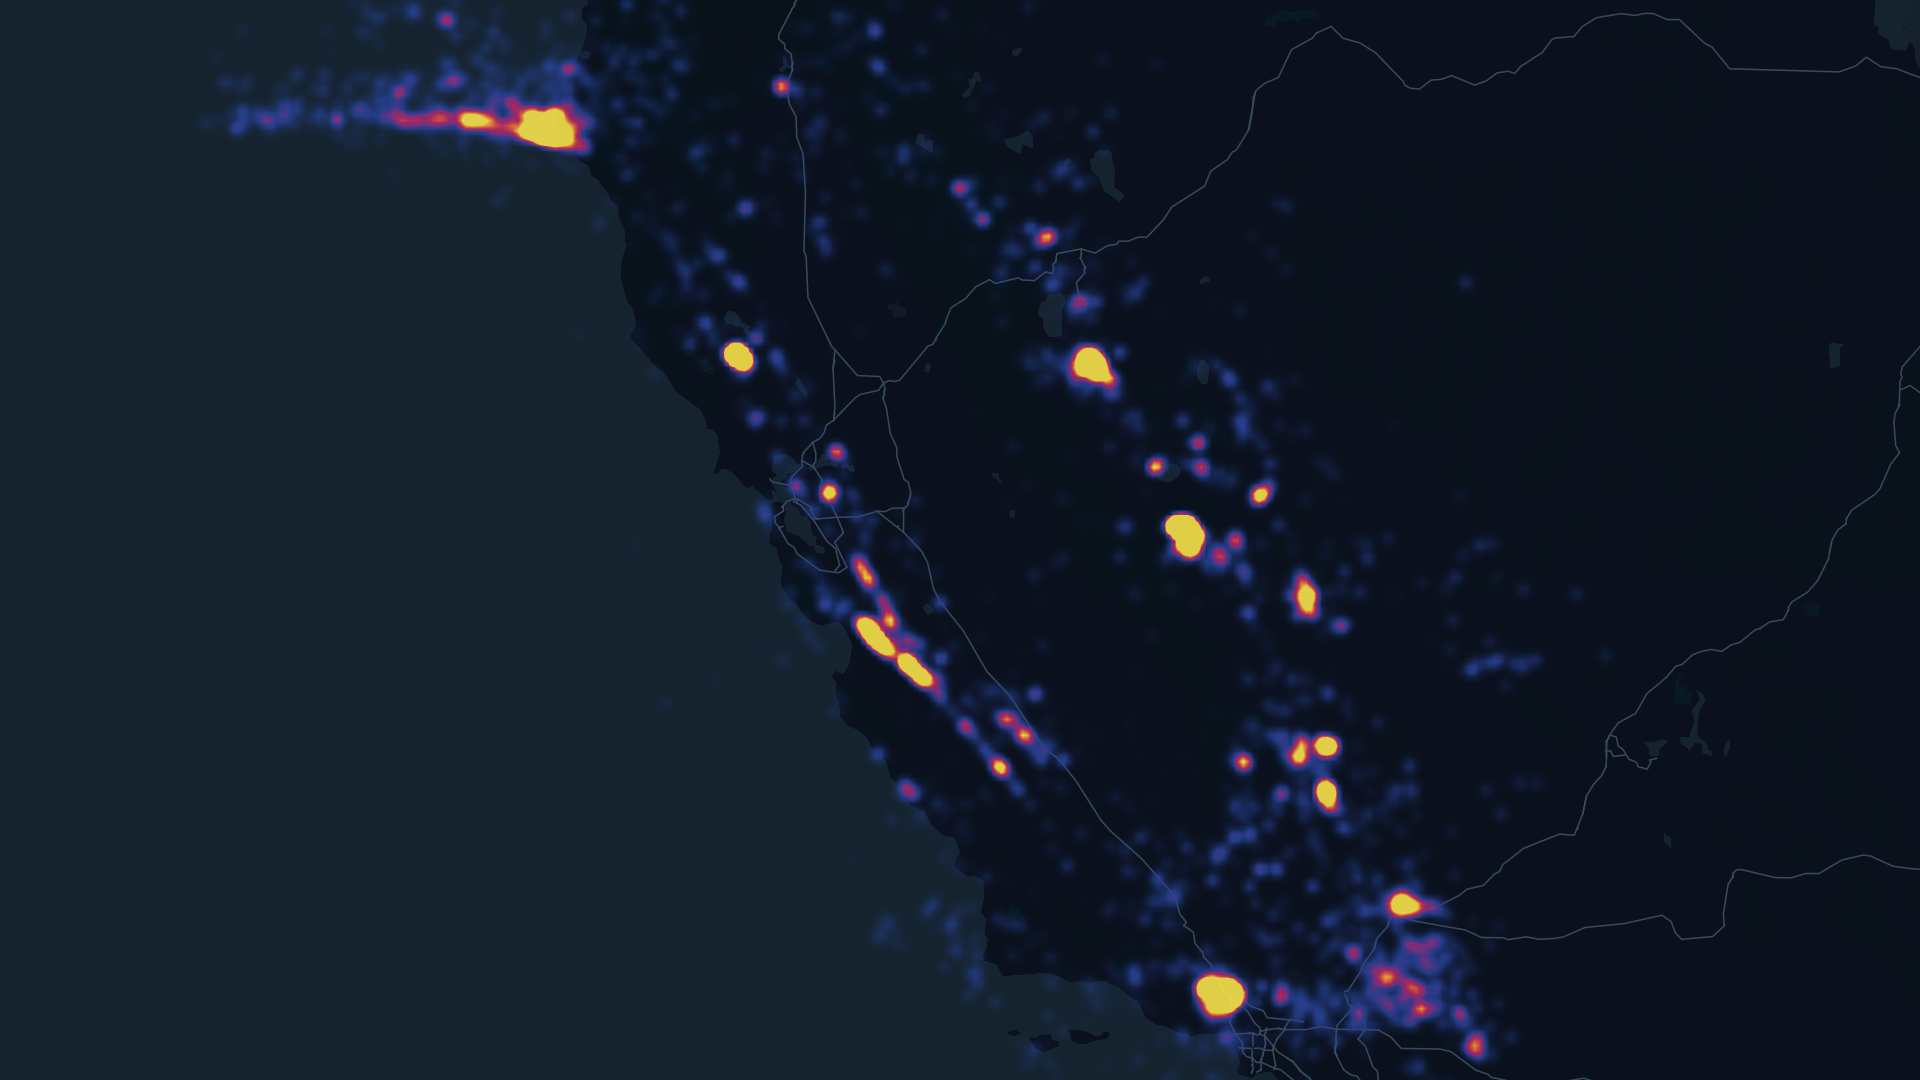
An example of the Heatmap Layer.
Settings
The following sections detail every setting for the Heatmap Layer.
Basic
Core settings for the Heatmap Layer.
| Setting | Description |
|---|---|
| Layer Type | Must be Heatmap to display the Heatmap Layer. |
| Dataset | The dataset to use for the Heatmap Layer. |
| Columns | Select a latitude and longitude. |
Color
Color settings for the heatmap.
| Setting | Description |
|---|---|
| Color Palette | The color palette of the layer. |
| Opacity | The opacity of the heatmap layer. |
Radius
The radius/coverage of the heatmap layer.
| Setting | Description |
|---|---|
| Radius | The radius of the heatmap. |
Weight
Weight settings for the heatmap. Weighing by a column increases the intensity of the map for points with the specified attribute.
| Setting | Description |
|---|---|
| Weight Based On | A column to base the weight on. |
Heatmap
General heatmap settings.
| Setting | Description |
|---|---|
| Intensity | Value that multiplied with the total weight at a pixel t obtain the final weight. A value larger than 1 biases the output color toward the higher end of the spectrum, while a value less than 1 biases the output toward the lower end of te spectrum. |
| Threshold | A larger threshold smoothens the boundaries of color blobs while making pixels with low weight harder to spot. |
JSON Schema
For details on how to programmatically specify layer properties, refer to the Studio Layer Configuration specification.
Updated 5 months ago
Did this page help you?