Analysis Modules
Studio's growing set of analysis modules are designed to generate powerful visualizations in minutes.

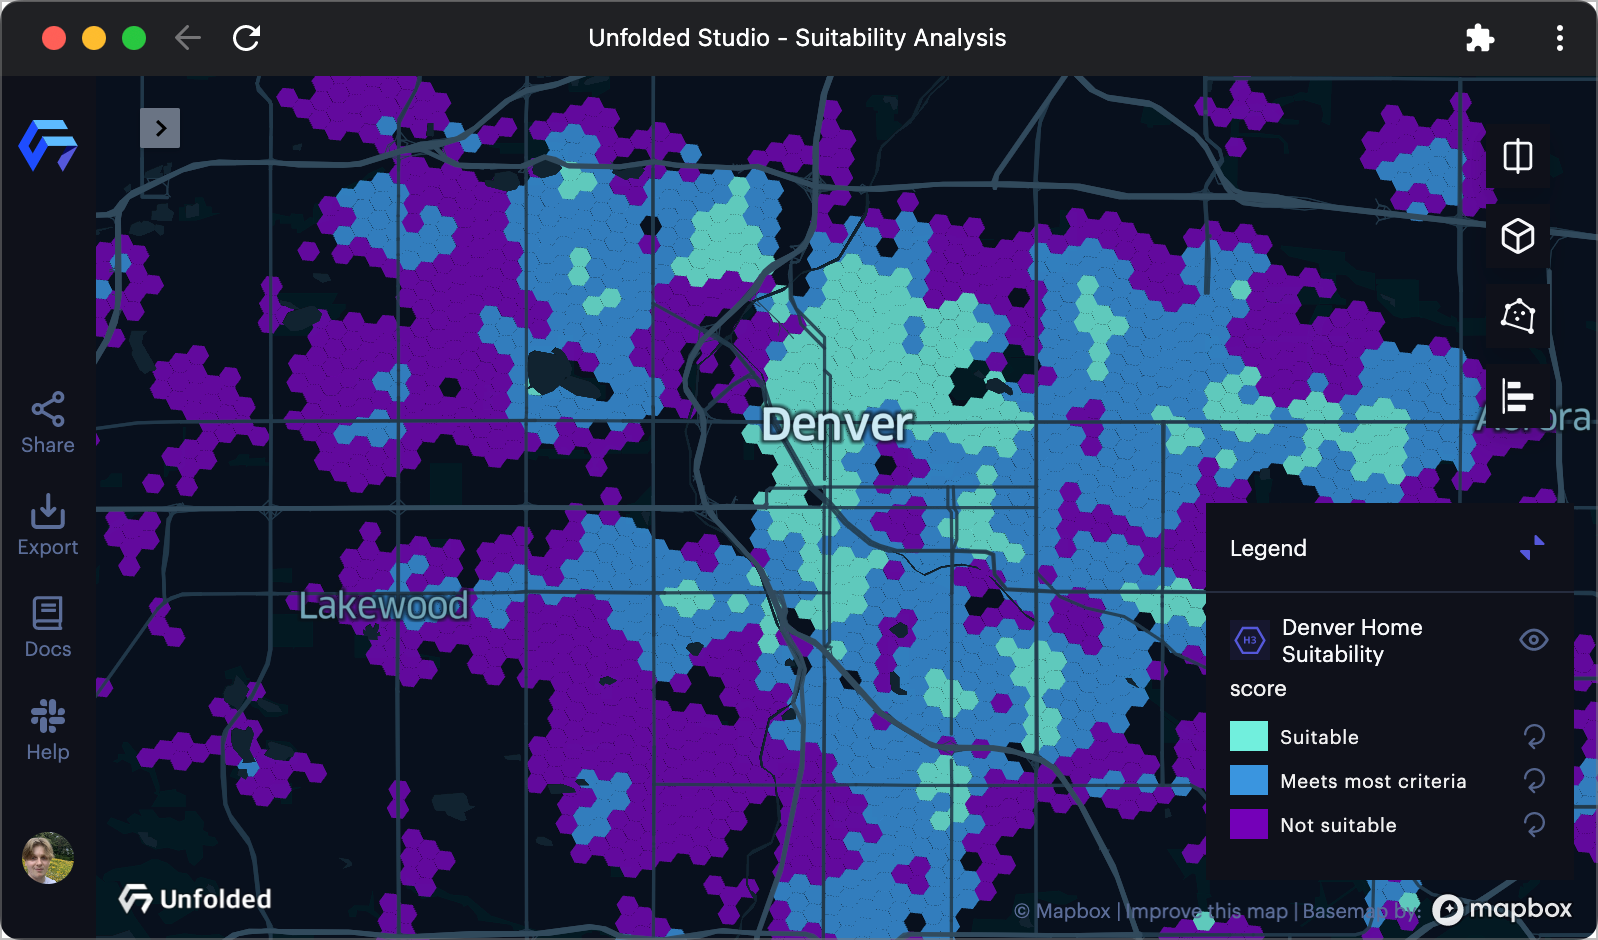
A home buying suitability analysis for Denver, CO
Analysis modules currently available in Studio:
| Module | Description |
|---|---|
| Cluster-Outlier Analysis | Identify statistically significant geographical clusters and outliers. As examples, you can use this feature to locate Covid outbreak zones or discover hot areas in your local housing market. |
| Suitability Analysis | Score site quality based on a set of user-defined criteria and weights. Find the optimal spot for housing developments, expansion locations, weather sensors, and much more. |
Benefits of Analysis in Studio
In many workflows, completing a spatial data analysis and visualizing the result requires many steps. For instance, you may need to:
- Collect, prepare, and clean pertinent datasets.
- Write python notebooks using libraries such as GeoDa, GDal, PySal, GeoPandas.
- Output the result in a tabular data format.
- Configure a visualization software (QGIS, Studio).
- Set up layers, apply a color scale, edit legend, and build charts.
- Share the map in an accessible format.
Studio's analysis modules aim to expedite spatial data analysis without limiting the user's power to extract valuable information from the data. Each analysis module parses your dataset to identify compatible columns and suggest optimal values for parameters. Advanced options allow users to modify every parameter used in the calculation.
Once the necessary fields are provided, Studio generates an interactive preview of the analysis. Changing any parameters updates the preview, providing instant feedback to changes in the analysis configuration.
Prepare Data in Studio
Raw, unprepared datasets can be processed using a wide range of tools offered within Studio. Using a combination of the tools below, you may never need to leave your browser while preparing data for analysis.
| Feature | Description |
|---|---|
| Geometric Expressions | Expressions that can be called while creating a new column. Create buffers, calculate centroids, and more. |
| Group By | Combine and aggregate data based on a selected field. The results of the operation are added to the project as a new derived dataset. |
| H3 Expressions | Access the H3 API to transform your data into hexagonal cells with spatial hierarchy. |
| Shapify | Generate polygons from columns containing supported identifiers, visualizing boundaries on your map. |
| Spatial Join | Combine attributes from one dataset to another based on their spatial relationship. |
Updated about 2 years ago
