Cluster and Outlier Analysis
The Cluster and Outlier analysis module allows you to calculate statistically significant hot-spots, cold-spots, and spatial outliers, then quickly visualize the results.
Using Cluster and Outlier Analysis, answer questions such as:
- Which areas of California are disproportionately affected by pollution?
- Are there any significant spatial patterns in the listing price of Berlin's Airbnbs?
- Which restaurants in New York have significantly more/fewer visits than nearby competitors?
Background
To conduct the Cluster and Outlier analysis, Studio applies Anselin's Local Indicators of Spatial Association (LISA), specifically the local Moran statistic, to identify geographical clusters of values or find geographical outliers.
This method has been widely used in spatial applications including environmental and natural resource analysis, real estate analysis, criminology studies, public health research, political geography and demographics studies, and much more.
Find examples and more information in the Cluster and Outlier Analysis use case article.
Perform Cluster and Outlier Analysis
Follow these steps to perform a cluster and outlier analysis in Studio.
Requirements:Cluster and Outlier Analysis requires your map to contain a
pointorgeojsonlayer withpointorpolygongeometries.
1. Open the Cluster and Outlier Analysis module
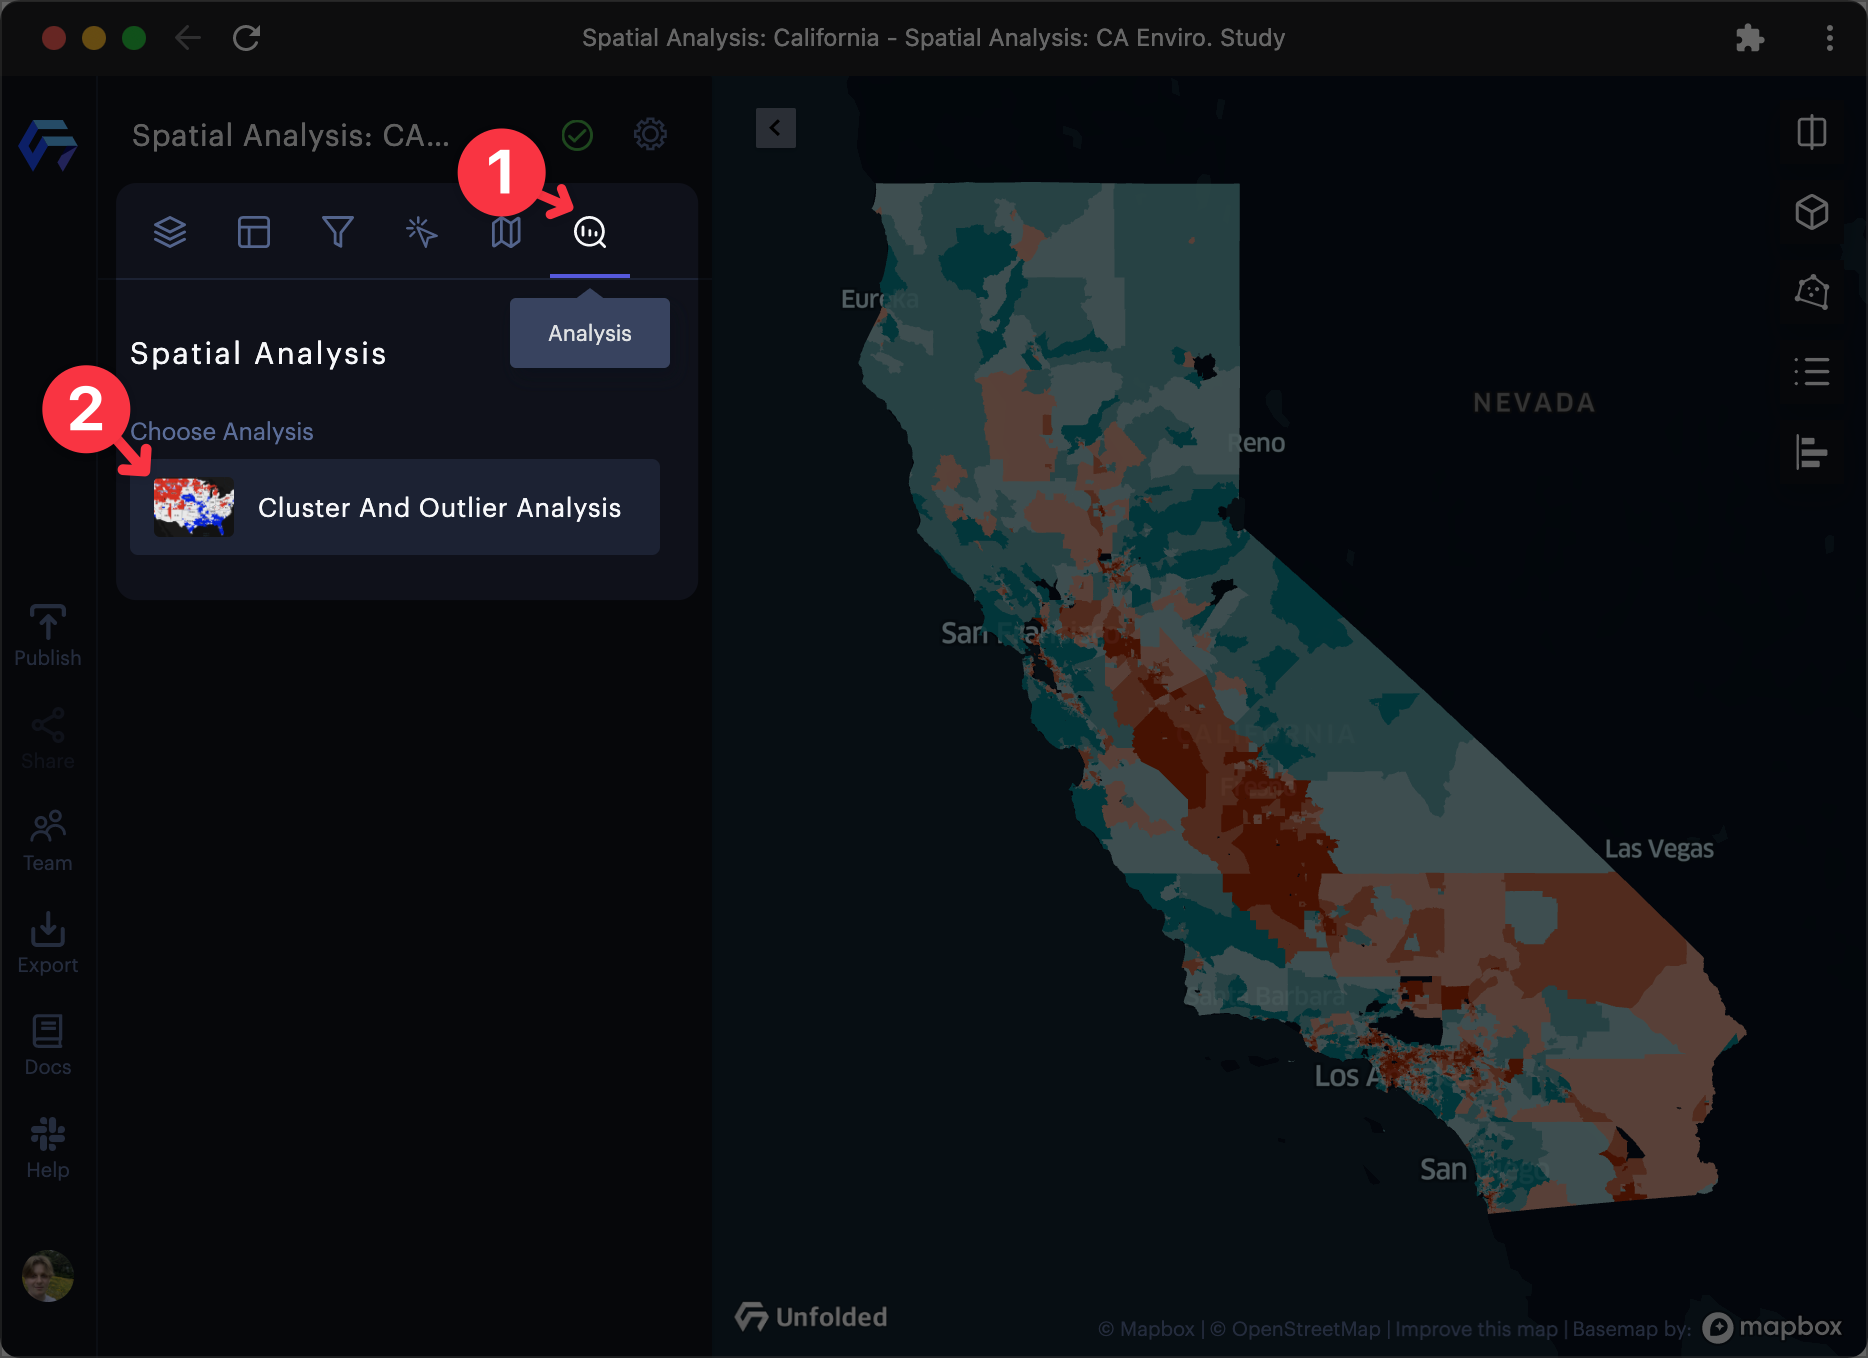
Navigate to the Analysis tab in Studio, then click Cluster and Outlier Analysis.

The Analysis tab in Studio, which contains spatial analysis modules.
2. Select an Input Layer from your map
The input layer must be a point or geojson layer with point or polygon geometries. This is the layer on which Studio will conduct the analysis of local Moran statistics.
3. Select an Attribute Field from the dataset
Select a field to use as values for the analysis of local Moran statistics. The attribute field must be from a dataset associated with your input layer.
SuggestionFor local Moran statistics, we recommend you select an attribute field containing quantitative variables.
4. Configure the Spatial Weights Creation
Studio provides two types of spatial weights:
Use # of Nearest Neighbors Weighting
Input the number of nearest neighbors to ensure all spatial objects have the same number of neighbors. Defaults to 4.
Use Distance Threshold Weighting
Input a distance unit (KM or Miles), creating a distance threshold to determine neighbors.
By default, Studio will suggest a distance that ensures each spatial object has at least one neighbor.
5. Configure the Local Moran Parameters
In local Moran statistics, permutation-based inference generates a pseudo p-value used to evaluate the significance of each cluster.
Studio allows you to modify the following local Moran parameters:
Control Distribution With Permutations
Permutations are used to determine the probability of finding the actual distribution of the values under analysis. This is accomplished by comparing many random datasets to the local Moran's I of your original data.
Input the number of permutations to compute the pseudo p-value. Defaults to 999.
Hide Less Significant Clusters With Thresholds
Input a number serving as a P-value threshold, allowing you to only display significant clusters on the map. Defaults to 0.05.
Note: In permutation-based inference, the smallest pseudo p-value is computed as
1/(permutations + 1).
For example, given a p-value of999, the smallest pseudo p-value is0.001.
6. Generate the results of the analysis
Click Run to generate the results of your cluster and outlier analysis.
The results of the analysis are shown in a preview table. If you are not satisfied with the results, tweak the parameters and click Rerun.
The results are stored in a data table containing the following columns:
| Column Name | Description |
|---|---|
| Attribute Field | The value of the selected Attribute Field |
| latitude (optional) | The latitude value, only when Input Layer is a Point layer |
| longitude (optional) | The longitude value, only when Input Layer is a Point layer |
| lisa | The local Moran's I value |
| spatial_lag | The average (standardized) value of the neighbors |
| cluster | The type of spatial association - 0 for not significant, 1 for High-High, 2 for Low-Low, 3 for High-Low, 4 for Low-High, 5 for isolated (no neighbors) |
| pvalue | The pseudo p-value is the significance value computed from the random permutations |
| neighbors | The array of row indices of the neighbors |
When you are satisfied with the results of your analysis, click Confirm to proceed to the visualization.
Analyze Results
Upon completing the cluster and outlier analysis, a new layer and dataset are generated.
Point Layer Results
If the input layer was a point layer, a connectivity graph will appear to visualize the neighboring/connectivity relationship among spatial objects. Mouse over a point to highlight neighboring points (defined by the spatial weights configuration).
Cluster Types
Cluster types are visualized by color-coding geometries to represent the cluster type. A chart will generate, serving as a legend for the cluster types.
The local Moran statistic takes the data values and the associated geographical locations as input, then returns statistically significant clusters in four types:
| Cluster | Description |
|---|---|
| High-High | Hot spot clusters with high values surrounded by other high values. |
| Low-Low | Cold spot clusters with low values surrounded by other low values. |
| High-Low | Spatial outlier with high values surrounded by low values. |
| Low-High | Spatial outlier with low values surrounded by high values. |
This visualization can be customized via the Layer configuration.
Interactive Example
CalEnviroScreen is a screening methodology that can be used to help identify California communities that are disproportionately burdened by multiple sources of pollution. Use the slider to view statewide data on the left, and a cluster/outlier analysis on the right.
Data source: https://oehha.ca.gov/calenviroscreen/report/calenviroscreen-40
Remarks
Use Cases
Find examples and other information in the Cluster and Outlier Analysis use case article.
Ongoing Development
The Cluster-outlier Analysis module is undergoing continued development. Visit our community Slack channel, or contact us directly via email for any inquiries regarding this module.
Updated 11 days ago
