Geospatial Filters
Draw a Filter
Using the Draw tool, you can create boundaries on the map and apply them as Filters. These boundaries are responsive, updating filters and charts as they are moved around the map.
Follow these steps to draw a boundary:
1. Click the polygon icon on the top right corner of the map to open the drawing panel.
2. Select Polygon or Rectangle, then begin drawing on the map.
- Polygon: Click on the map to add vertices. Click on the first vertex to close the shape.
- Rectangle: Click and drag to adjust the shape of the rectangle. Release the mouse button to close the shape.
Select Geometries
If you have geometries on the map (deriving from the Polygon, H3), you can simply click on them, then choose Select from the tooltip menu. A boundary will be drawn around the select boundary.
Note: Tooltips must be enabled to select polygons.
You are presented with three options:
Filter Layers
Click Filter Layers then choose a layer to filter its data points to only those contained in the shape.
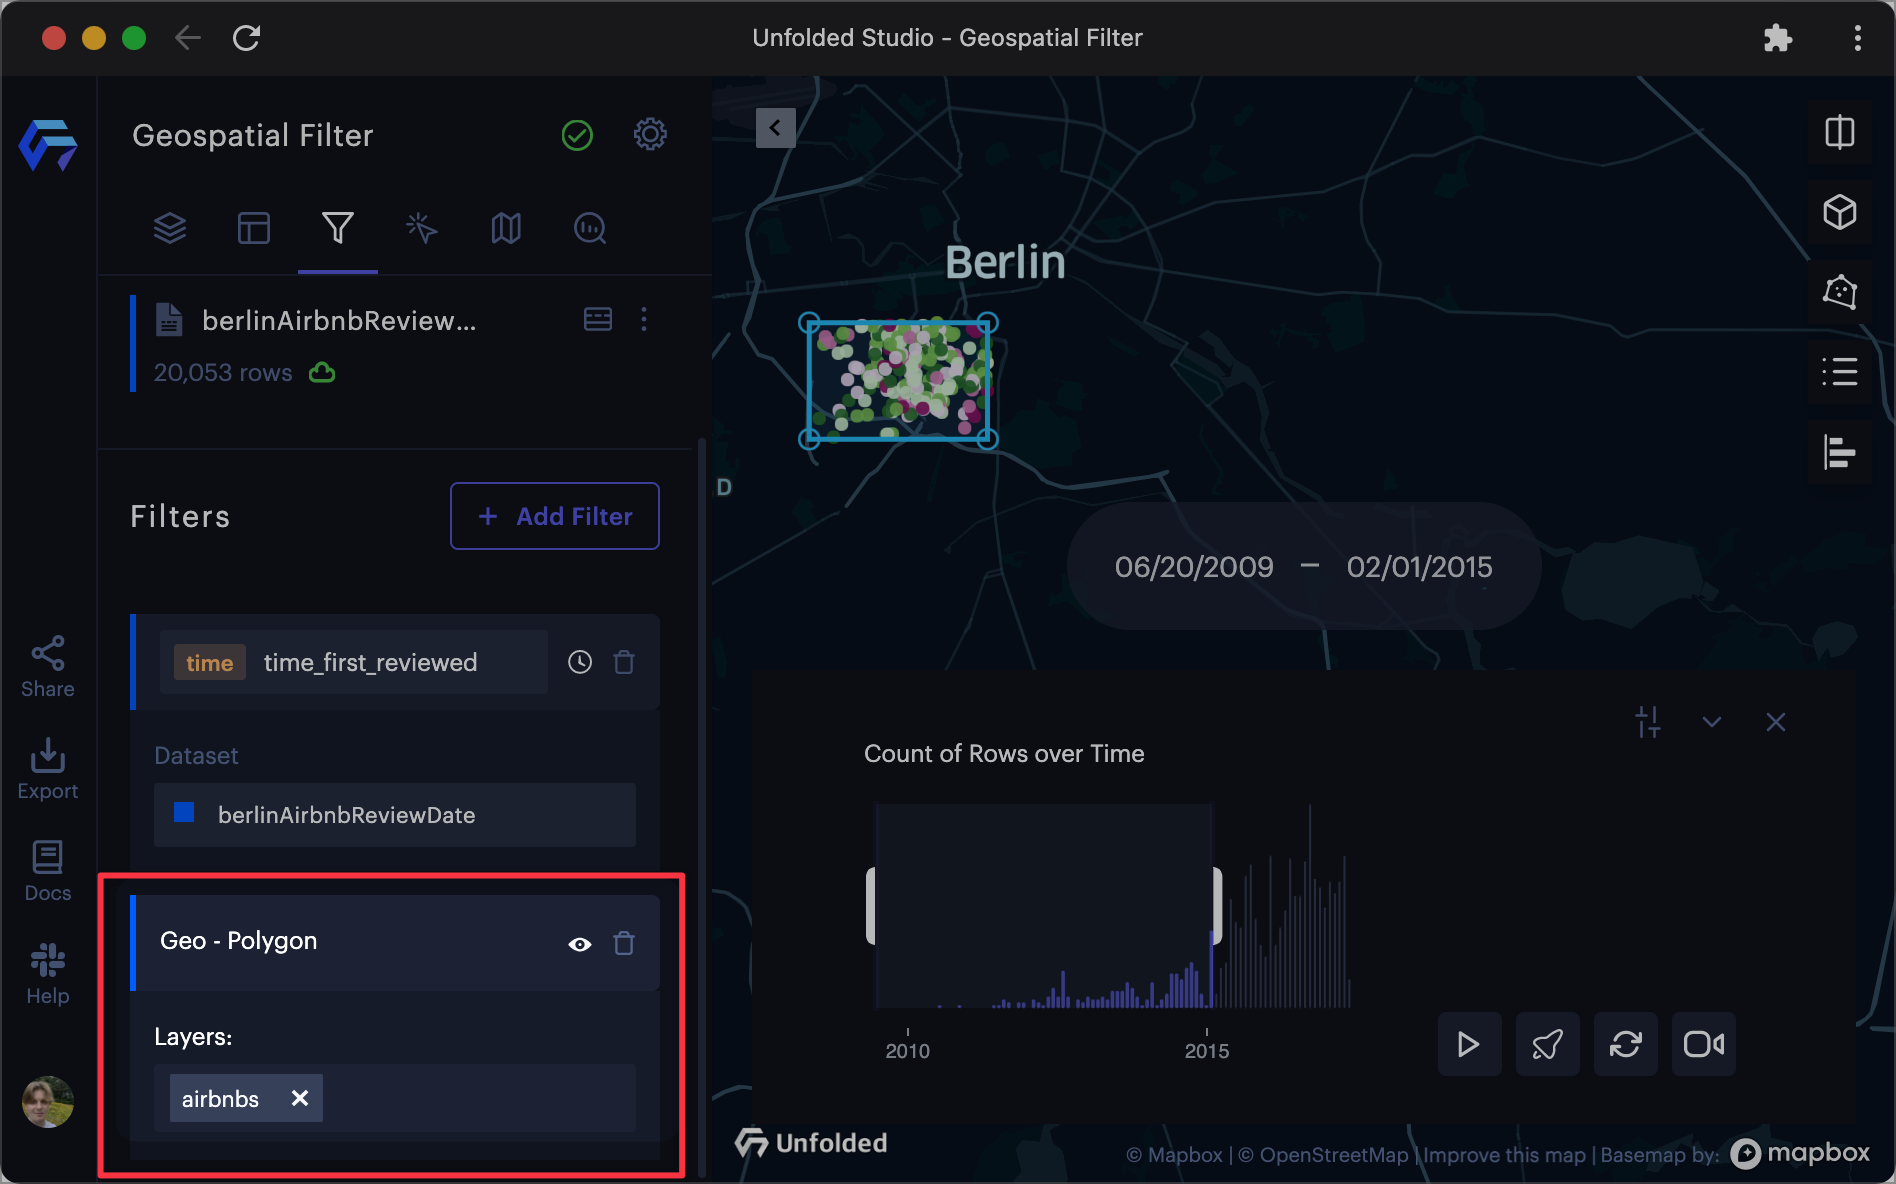
The geospatial filter will appear in the filter panel.

The geospatial filter in the filter panel.
Filter Polygons
You can filter Polygon layers by creating a geospatial boundary. Only polygons that have centroids within the boundary will be displayed.
Creating Several Filters
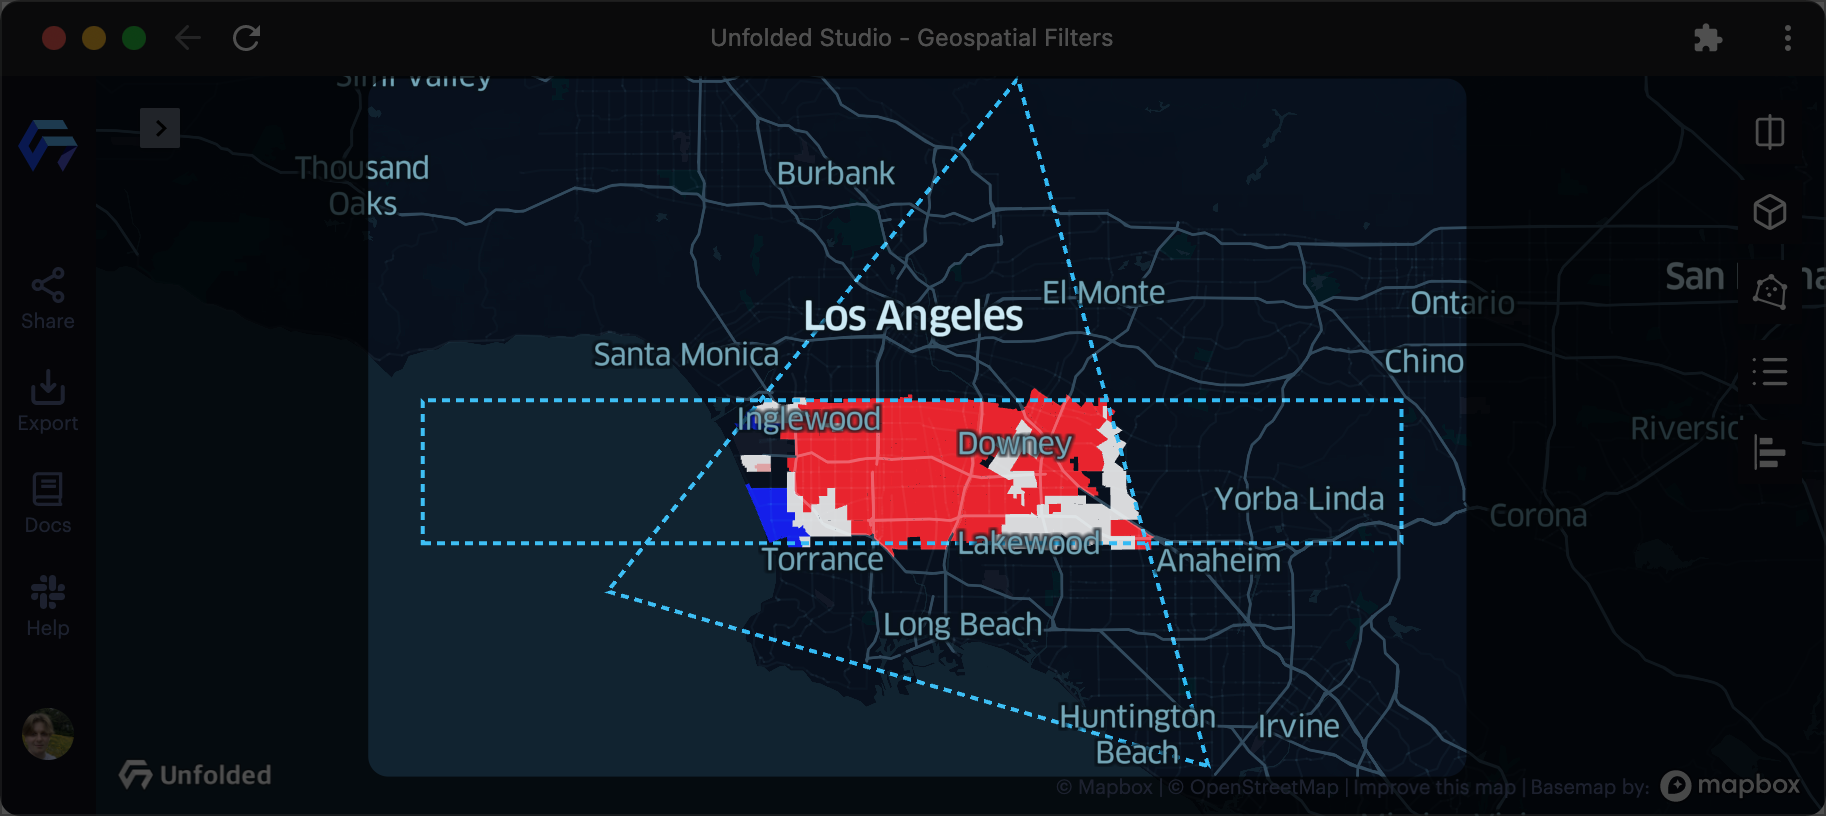
Multiple geospatial boundaries can be drawn on the same map to filter the map in an AND operation.

Two filters applied to the same map.
Note: If the map's geospatial filters do not share a common area, no data will be displayed.
Export Filtered Datasets
After filtering your dataset, you can choose to export the filtered dataset.
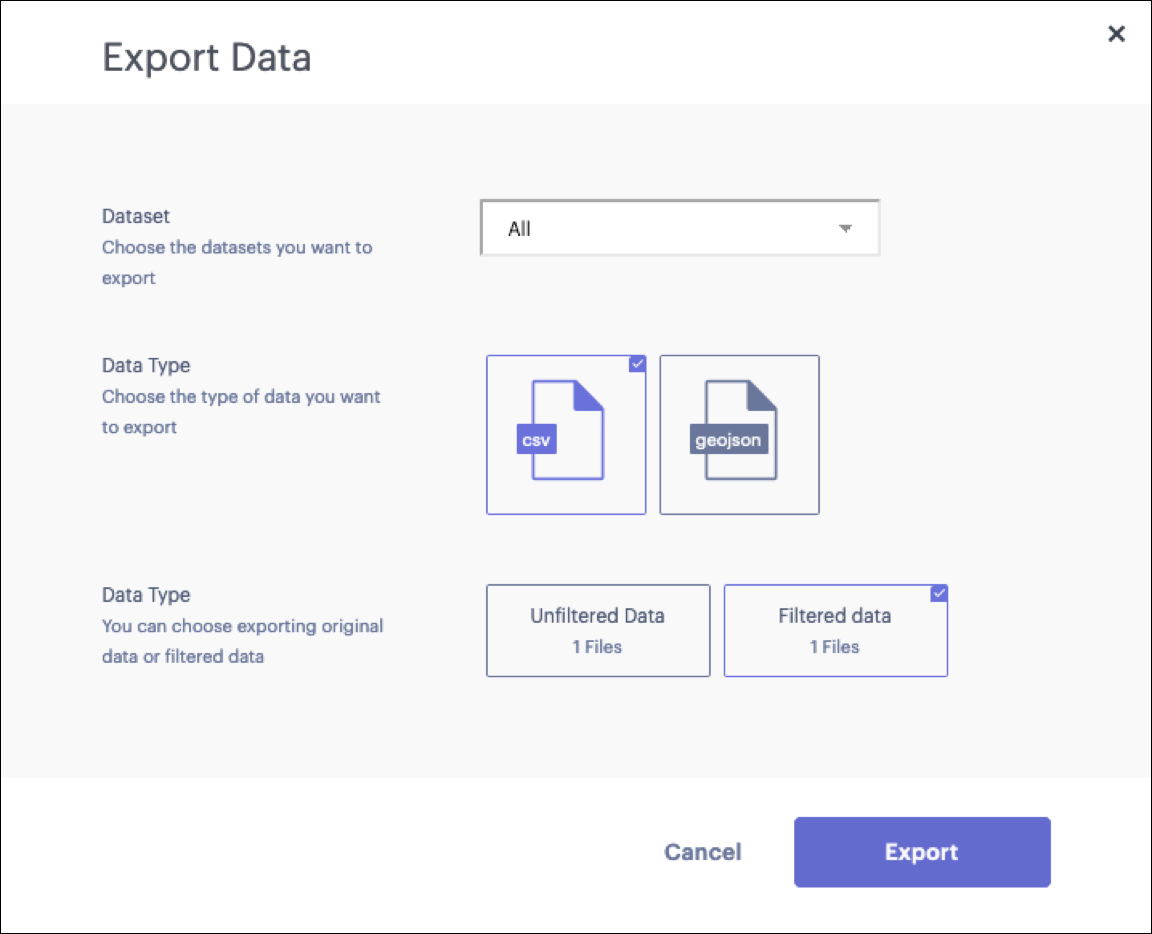
To do so, simply click Export then select Filtered to include only filtered data.

The Export Data window.
Name your dataset then click Export to download the filtered dataset.
You can extract your filtered dataset in either CSV or GeoJSON format.
Copy Geometry
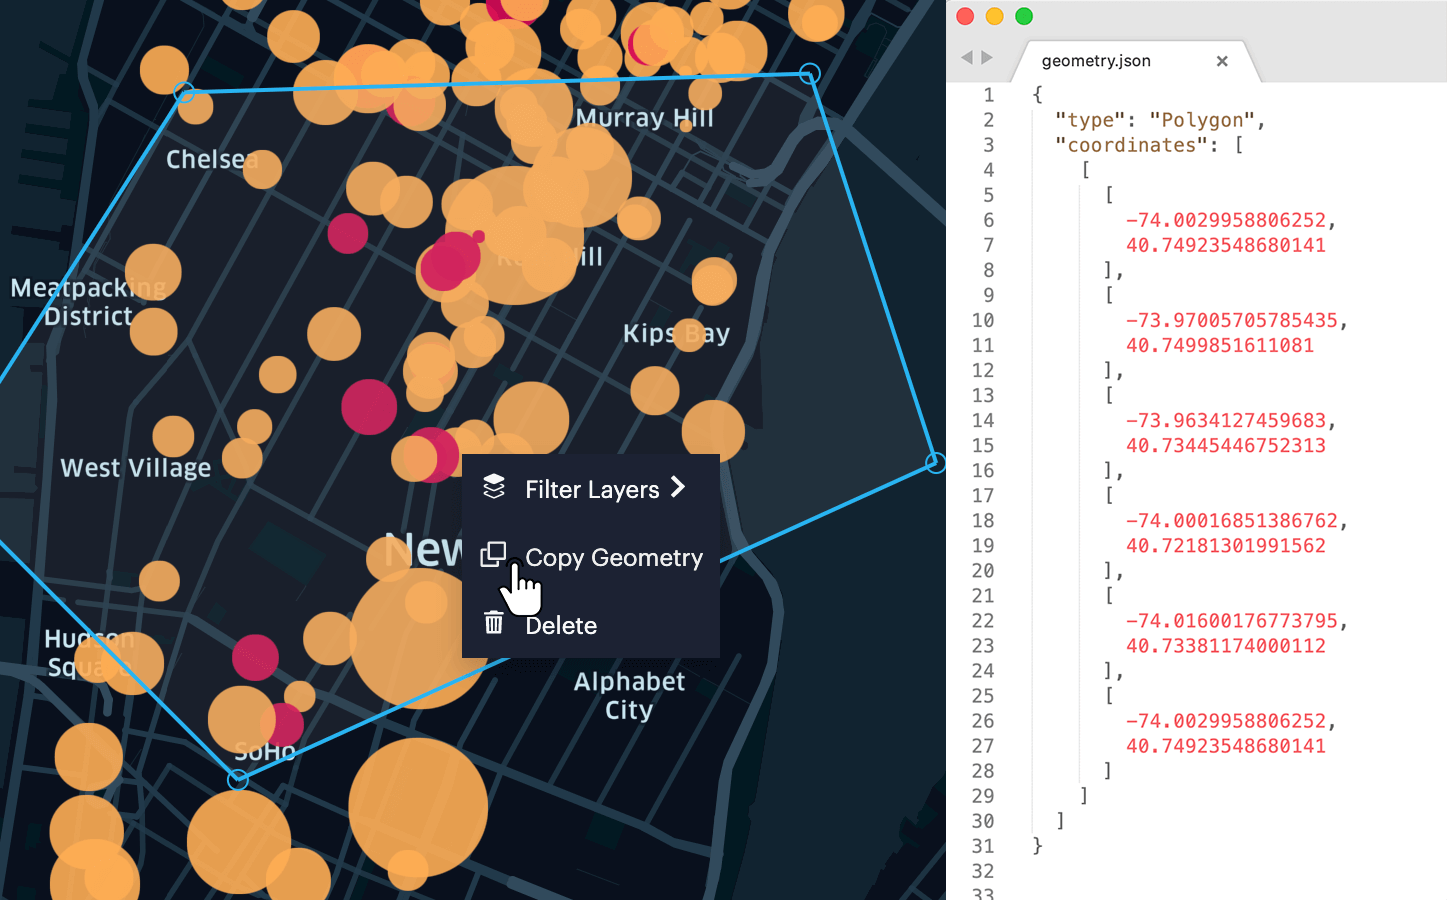
Click Copy to copy the geometry of the boundary feature as a GeoJSON string. The geometry is copied to your clipboard, allowing you to paste it into any text editor.

A geospatial region and its copied GeoJSON string.
Delete Selection
Click Delete to delete the selected geometry.
Note: This function only deletes the drawn geometry. This does not delete any layers or data within the shape.
Updated 11 days ago
