Suitability Analysis
The Suitability Analysis module evaluates potential site locations for a particular use by computing a suitability score based on a set of user-defined criteria and weights.
Suitability Analysis helps to answer questions such as:
- Where is the best location for a new housing development, business, retail outlet, restaurant, or facility like fire station, power station etc.?
- What areas of the forest can best serve as a resettlement habitat for the endangered species?
- Within the expansion region, which area will facilitate optimal sales growth?
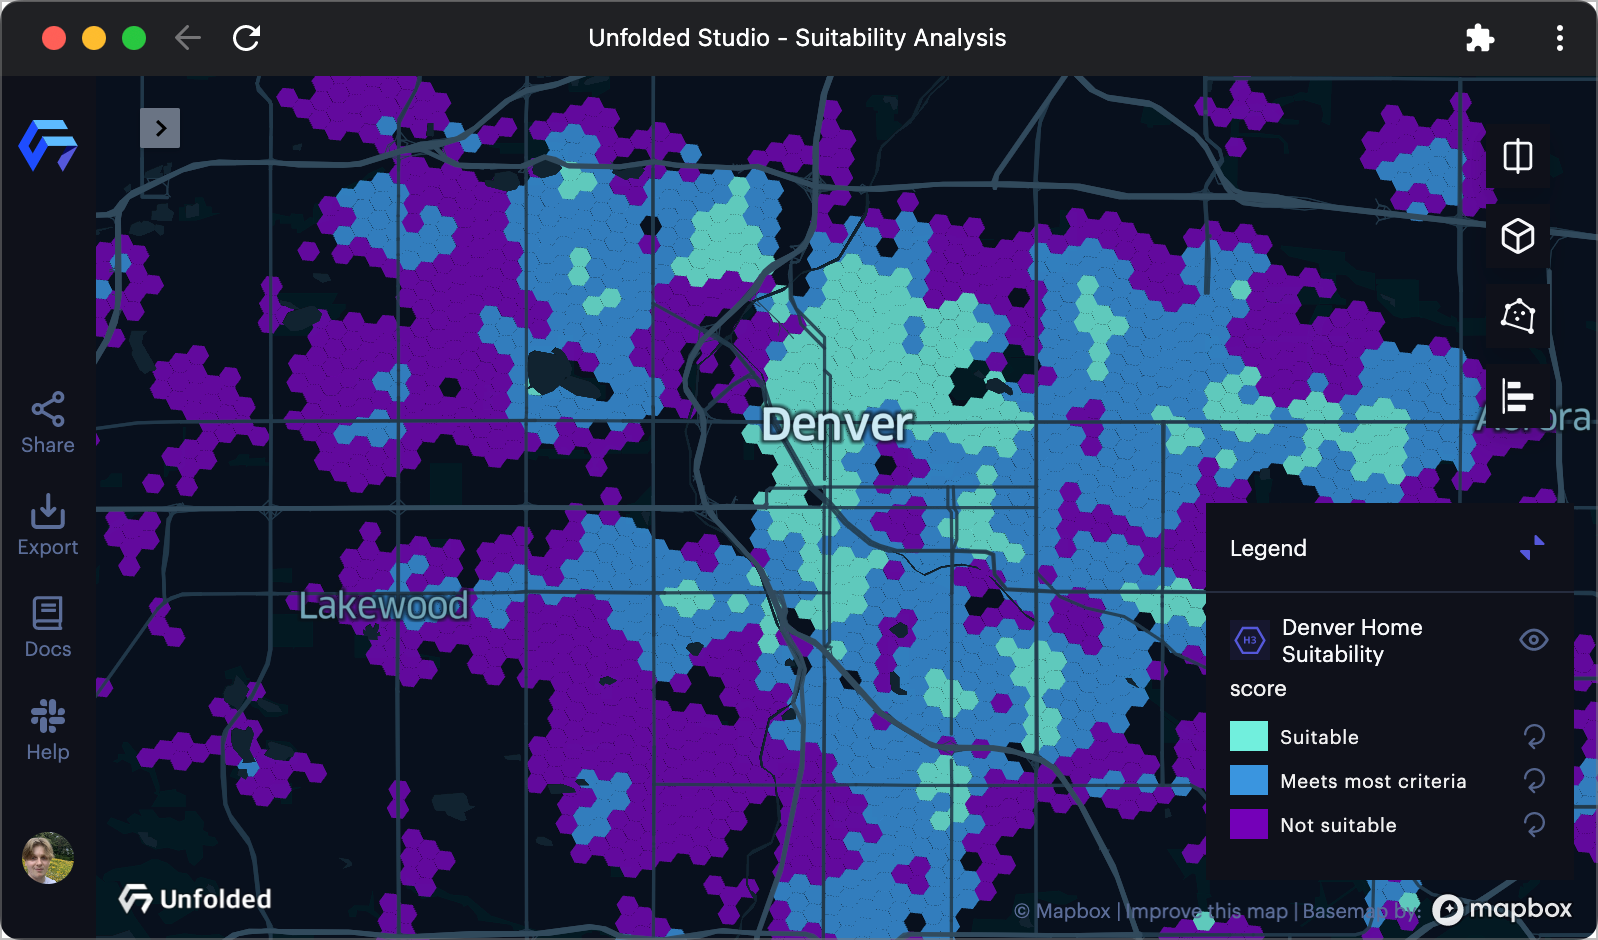
A home buying suitability analysis for Denver, CO
Background
The Suitability Analysis requires a layer populated from a dataset. In this dataset, each row must contain a geometry object (such as a hexagon, polygon, point, or line) representing the potential sites/facilities, which will be evaluated using the weighted values of other attributes in the row.
If your dataset lacks geometry features, Studio provides a wide range of tools that can be used to enrich your dataset with geometries. For example, administrative boundaries can be obtained using Shapify, geometries can be merged in Group By operation, joined using a Join operation, or generated as buffers around locations on the map.
The suitability analysis relies on the attributes to appropriately assess a suitability score for each candidate site. These attributes are usually identified and quantified by domain experts. If you prepare the attribute data in multiple datasets, Studio provides tools like filter/join/spatial join/merge to help you unify these data into a single dataset. Studio also provides a wide range of country-level datasets (such as Population, Race, Income, Age, Households, Education, Weather, Business, FSQ visits, FSQ POIs etc.), which can be easily integrated in your dataset using Hex Tiles via Enrich, Extract, and Join operations.
Perform a Suitability Analysis
Follow these steps to perform a suitability analysis in Studio:
1. Open the Suitability Analysis module
Navigate to the Analysis tab in Studio, then click Suitability Analysis.
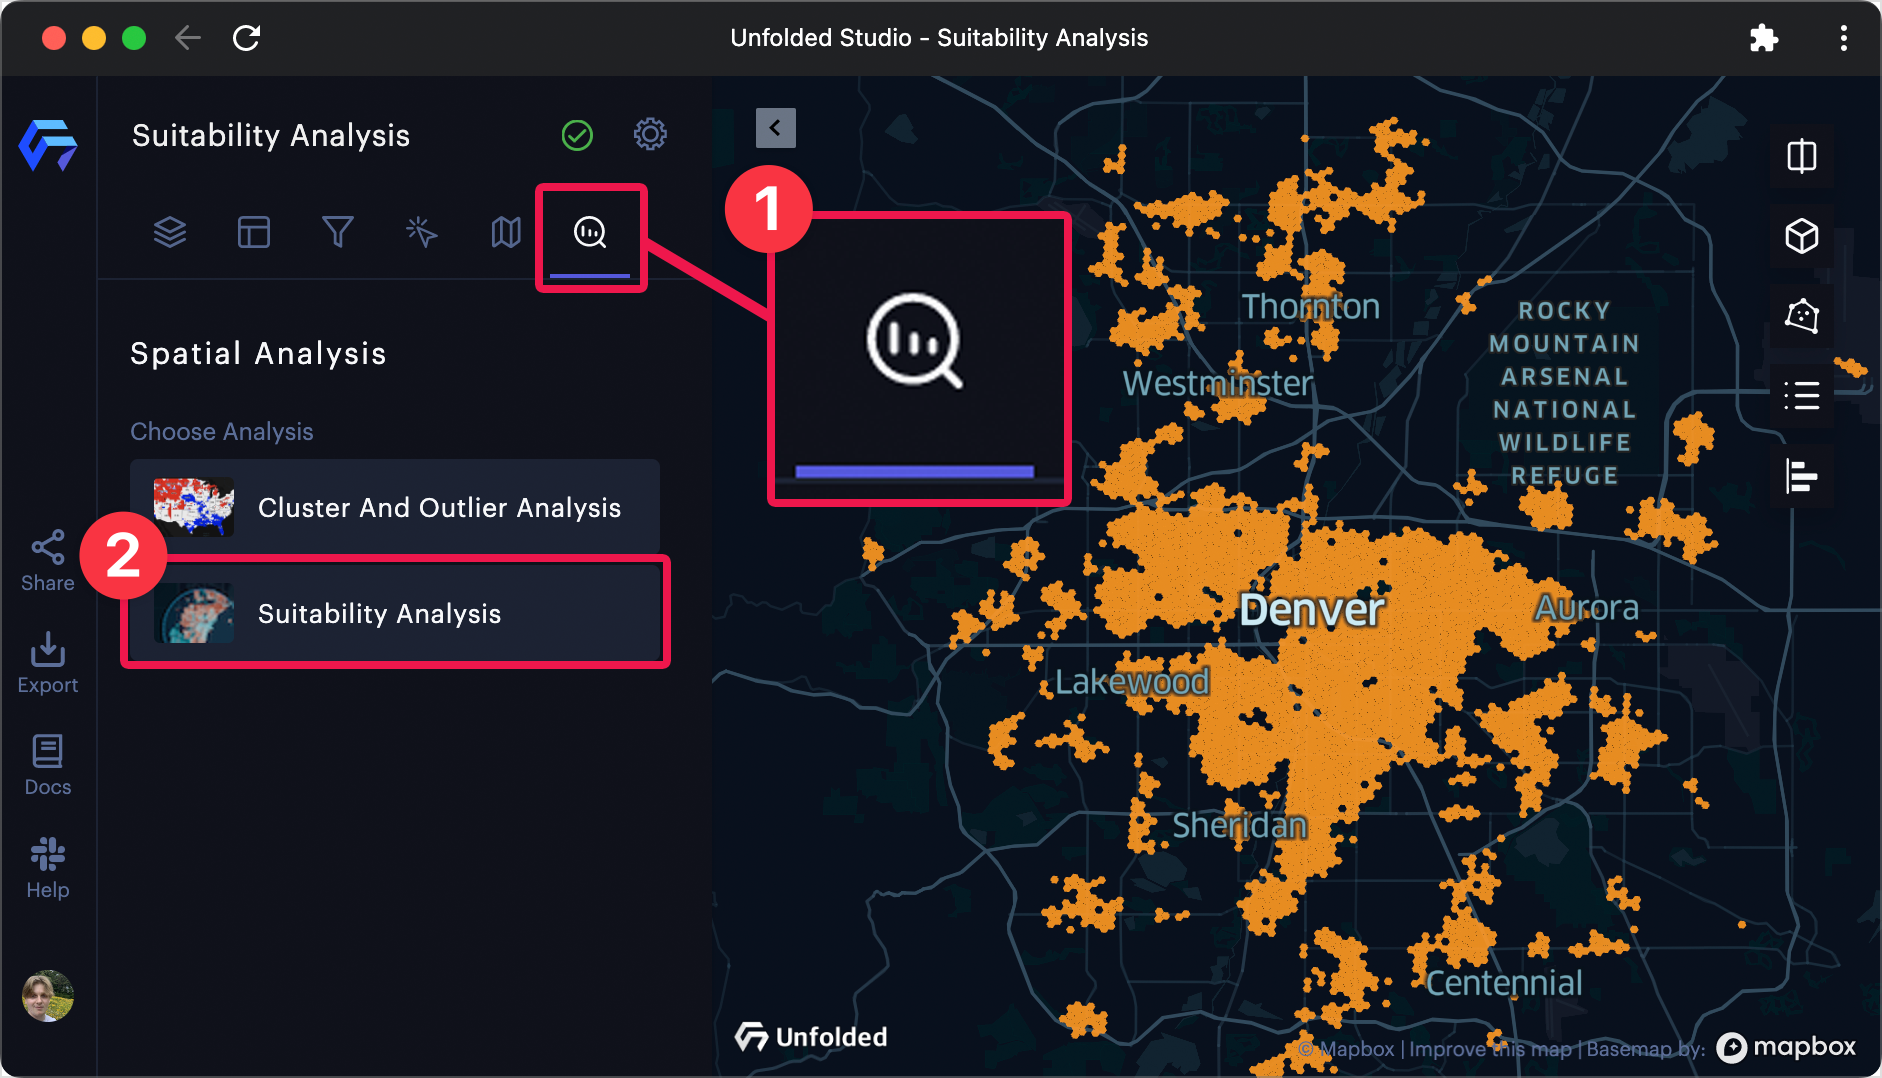
The Analysis tab in Studio, which contains the suitability analysis module.
2. Select an input layer from your map
As noted above, the input layer must have rows with geometry objects and weighted values in other columns.
3. Adjust the weight of the attribute fields
To adjust the weight of any attribute, either drag the slider or type any number in the default 0-1 range, which is adjustable in advanced settings. Attributes with larger weights will have a greater impact on the suitability score.
💡 Tip
Use negative weight value to represent
negativeimpact of attribute. For example, you can set the weight value ranges [-1, 1] in advanced settings.
You can also rename the name of the computed field by editing the Output Field textbox. By default, the column is named score.
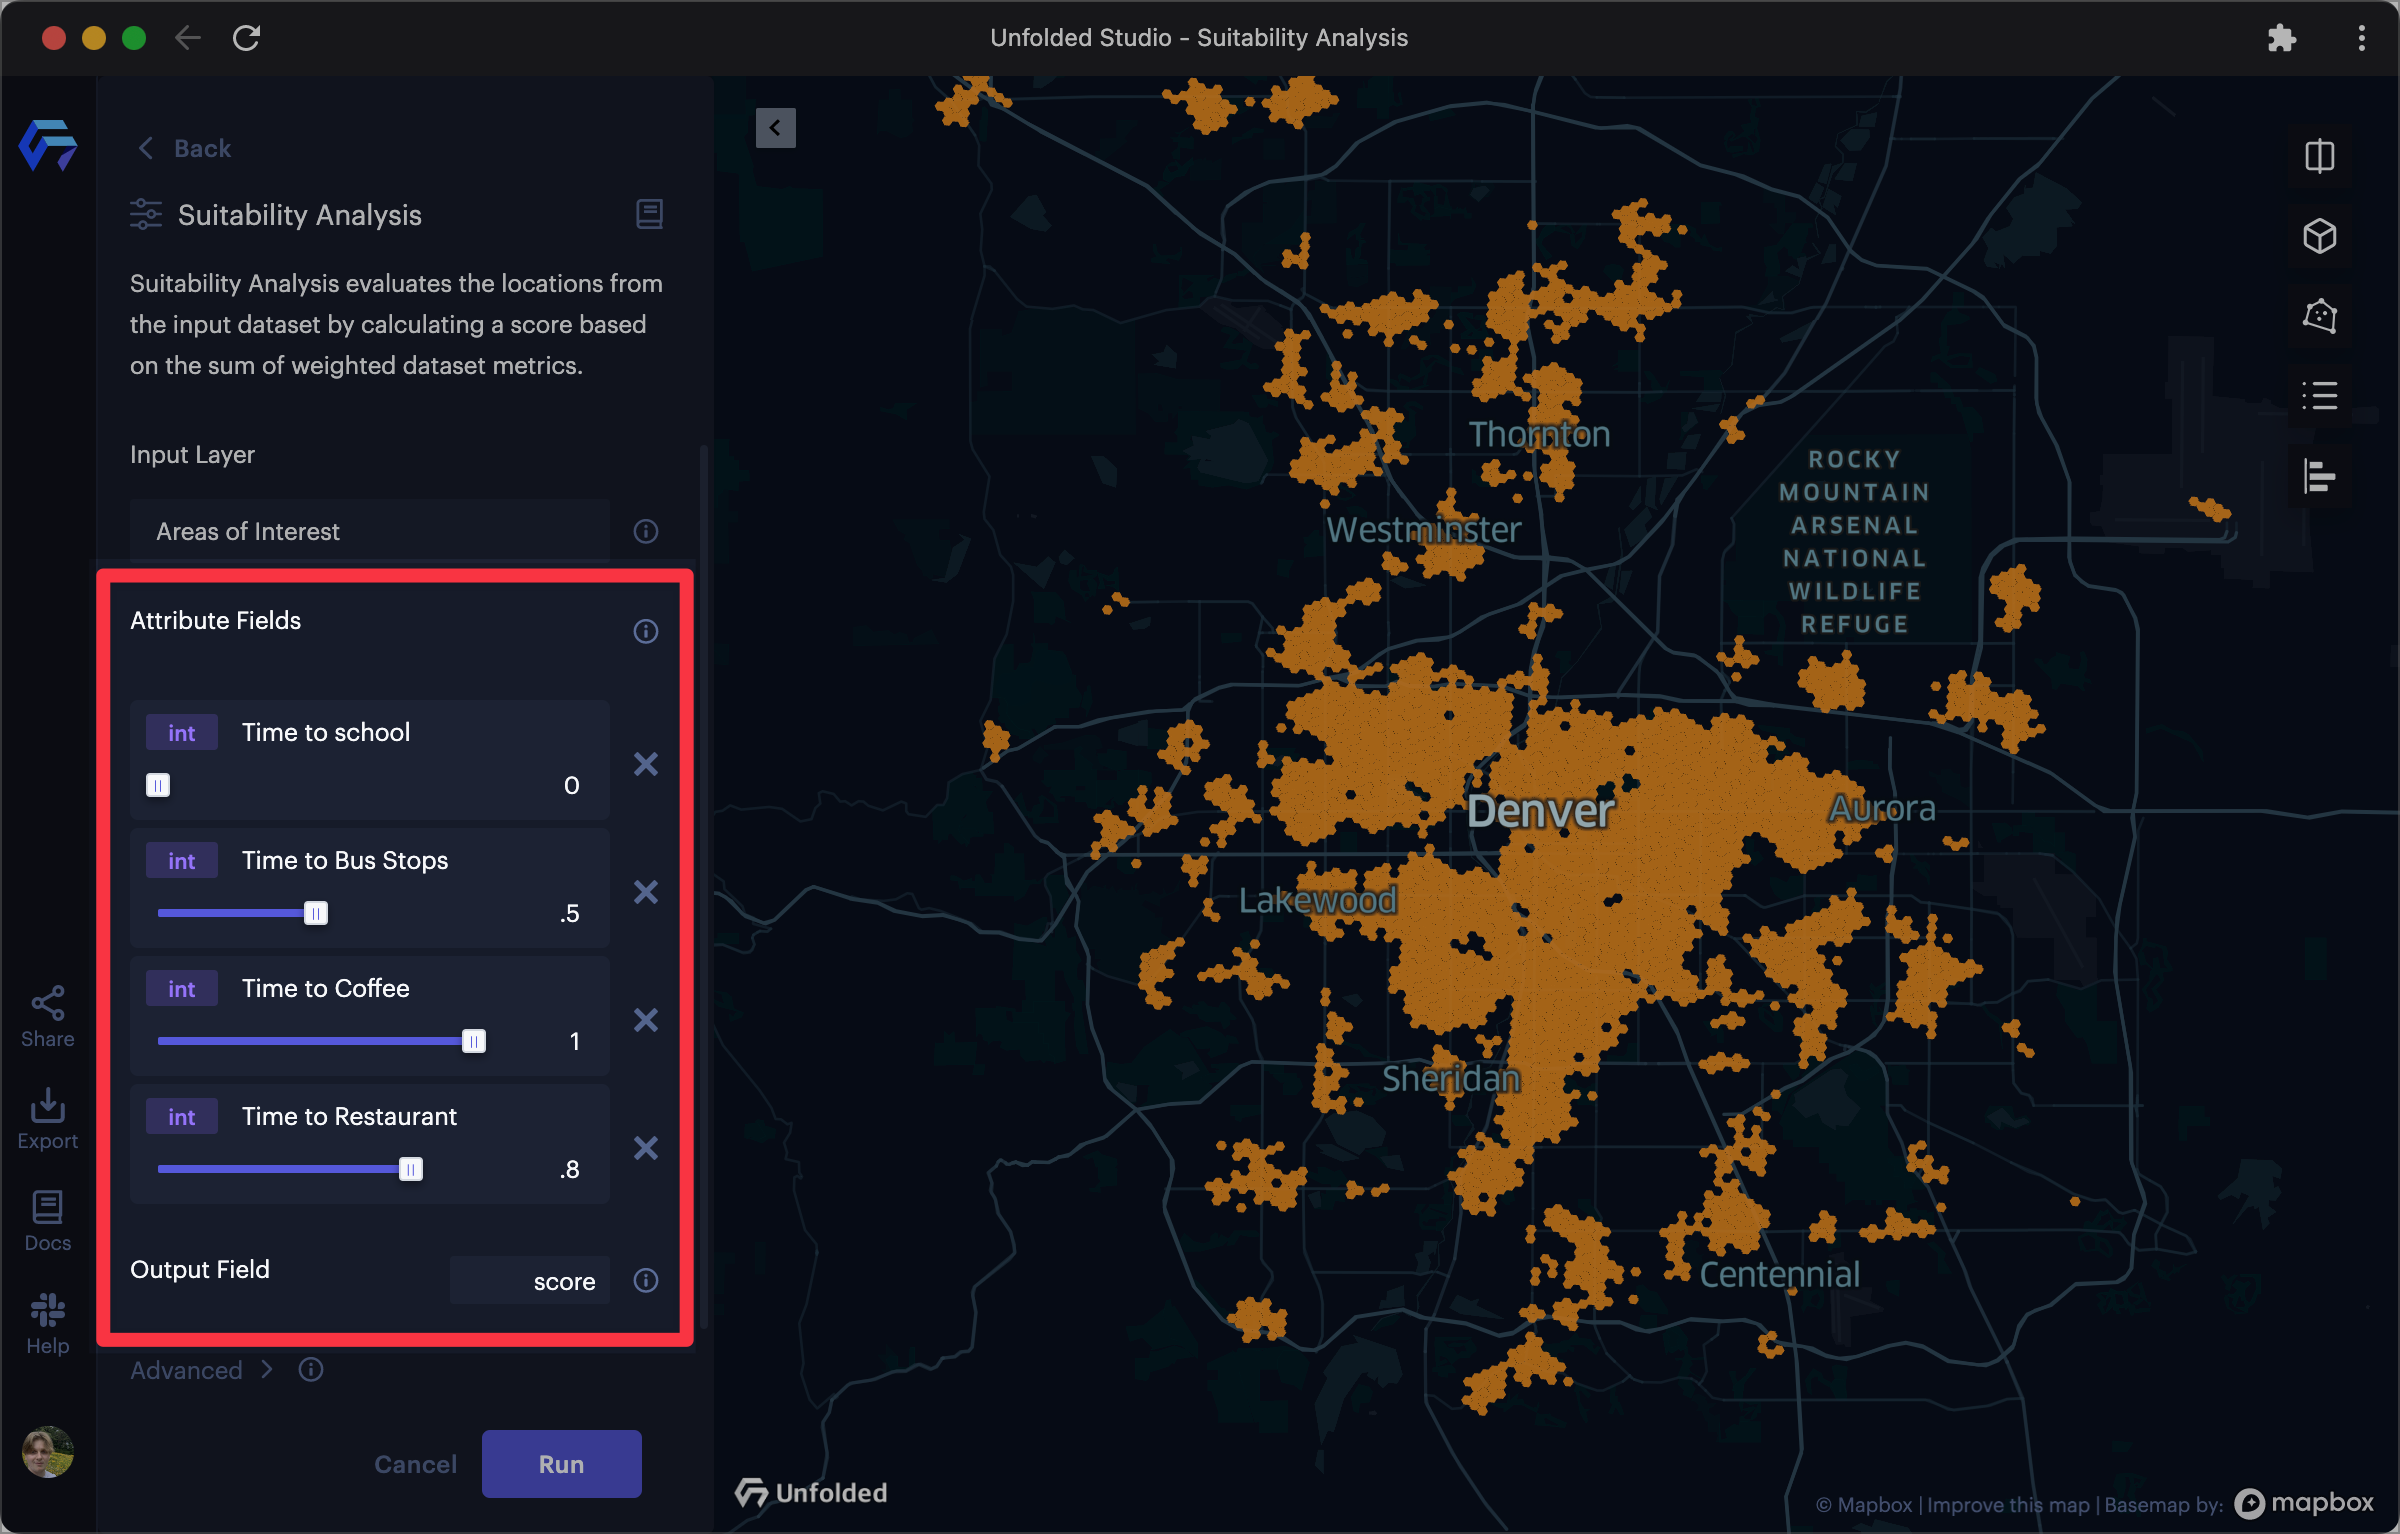
Creating custom weights for attribute fields in a suitability analysis
4. (Optional) Edit advanced settings
The suitability analysis allows you to edit several advanced parameters used to compute the score.
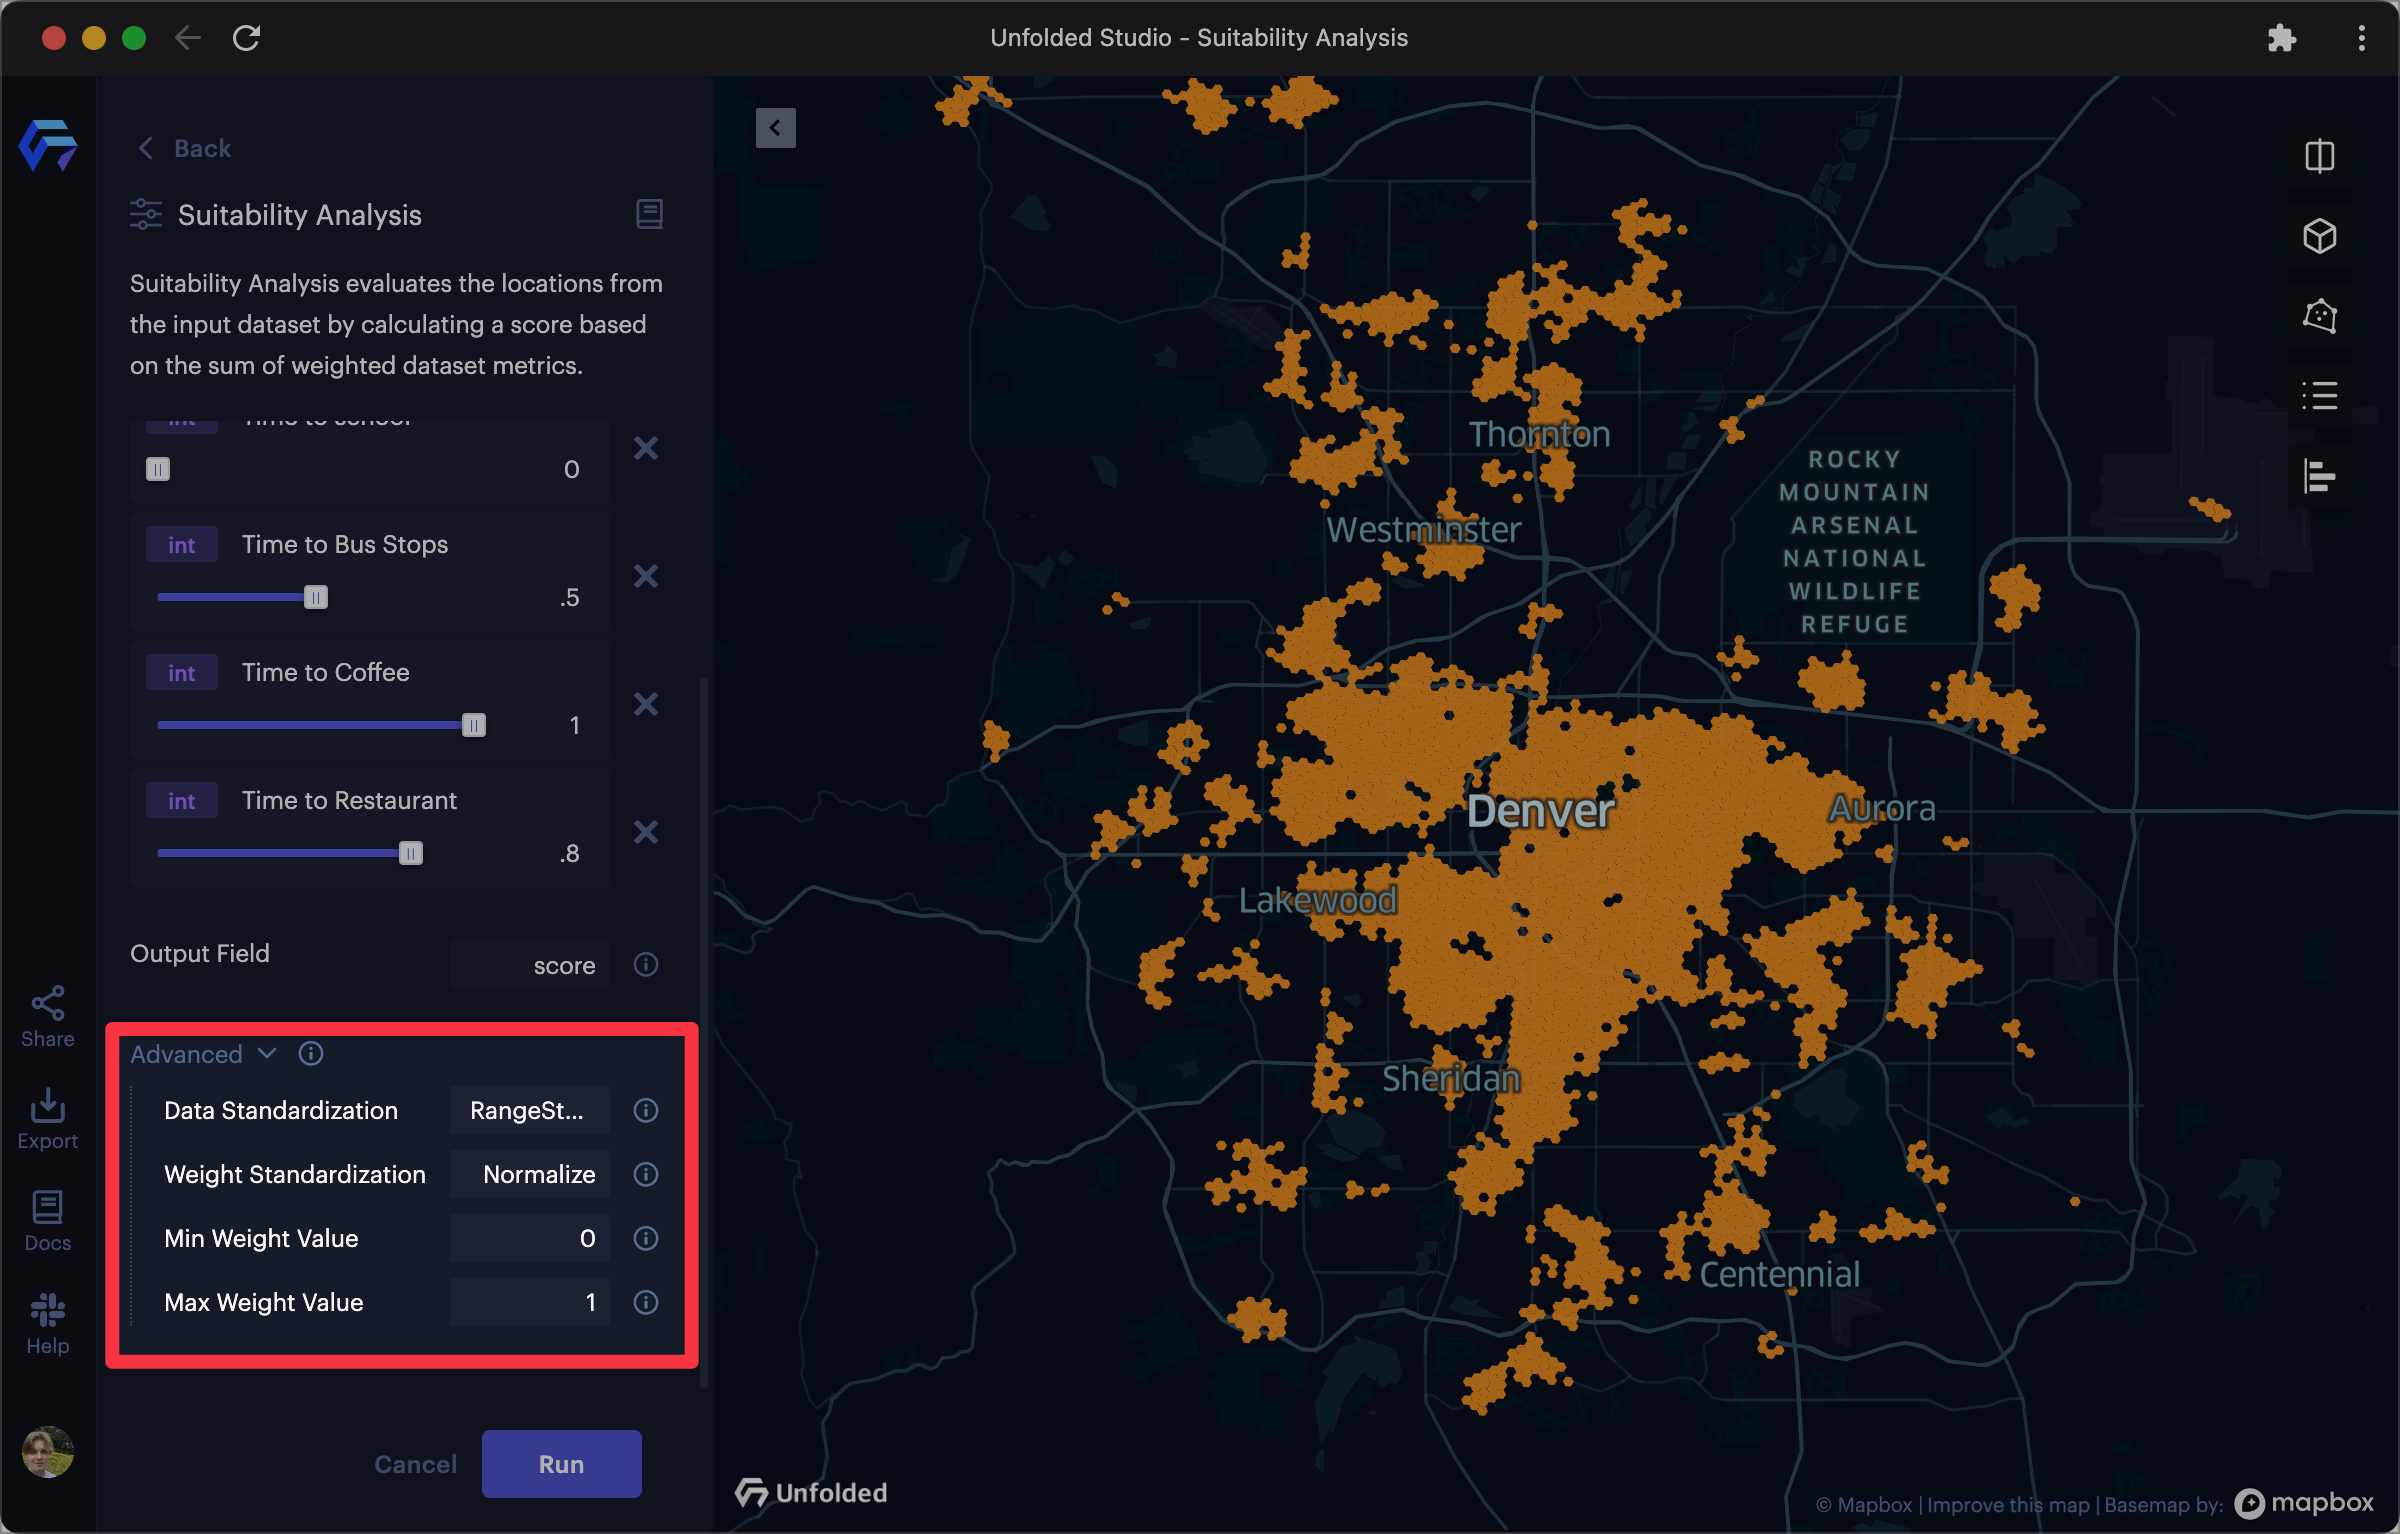
Advanced suitability analysis settings
There are three available methods for Data Standardization:
| Method | Descriptions |
|---|---|
| Range Standardization (Default) | All values are normalized between 0 and 1. |
| Z Standardization | Standardization where mean = 0 and standard deviation = 1. |
| Raw | No data standardization applied. This option is for users that have standardized the data or are using categorical data. |
In addition, there are two options for Weight Standardization:
| Method | Description |
|---|---|
| Normalize (Default) | Weights are normalized such that the sum of the weight values equals 1. |
| Raw | No weight standardization applied. This option is useful for users who have already applied weight standardization to the data. |
Min Weight Value sets the minimum bound for the weight value (Default: 0).
Max Weight Value sets the maximum bound for the weight value (Default: 1).
5. Click Run to generate the suitability analysis
A table appears displaying the suitability analysis dataset. In addition, a preview of the suitability layer is displayed on the map.
While previewing the results, you can alter the parameters of the analysis to automatically update changes to the dataset and map. View the example below:
6. Click Confirm to add analysis results to the map
Once confirmed, the results from the suitability analysis are added to the map with:
- A new dataset (connected via a dotted line to the dataset from which it is derived)
- A new layer colored by the score of each site analyzed
Analyze Results
Once the results are added to the map, you may want to modify the display configuration of the suitability layer.
Navigate to the Layers tab and expand the new Suitability Result layer.
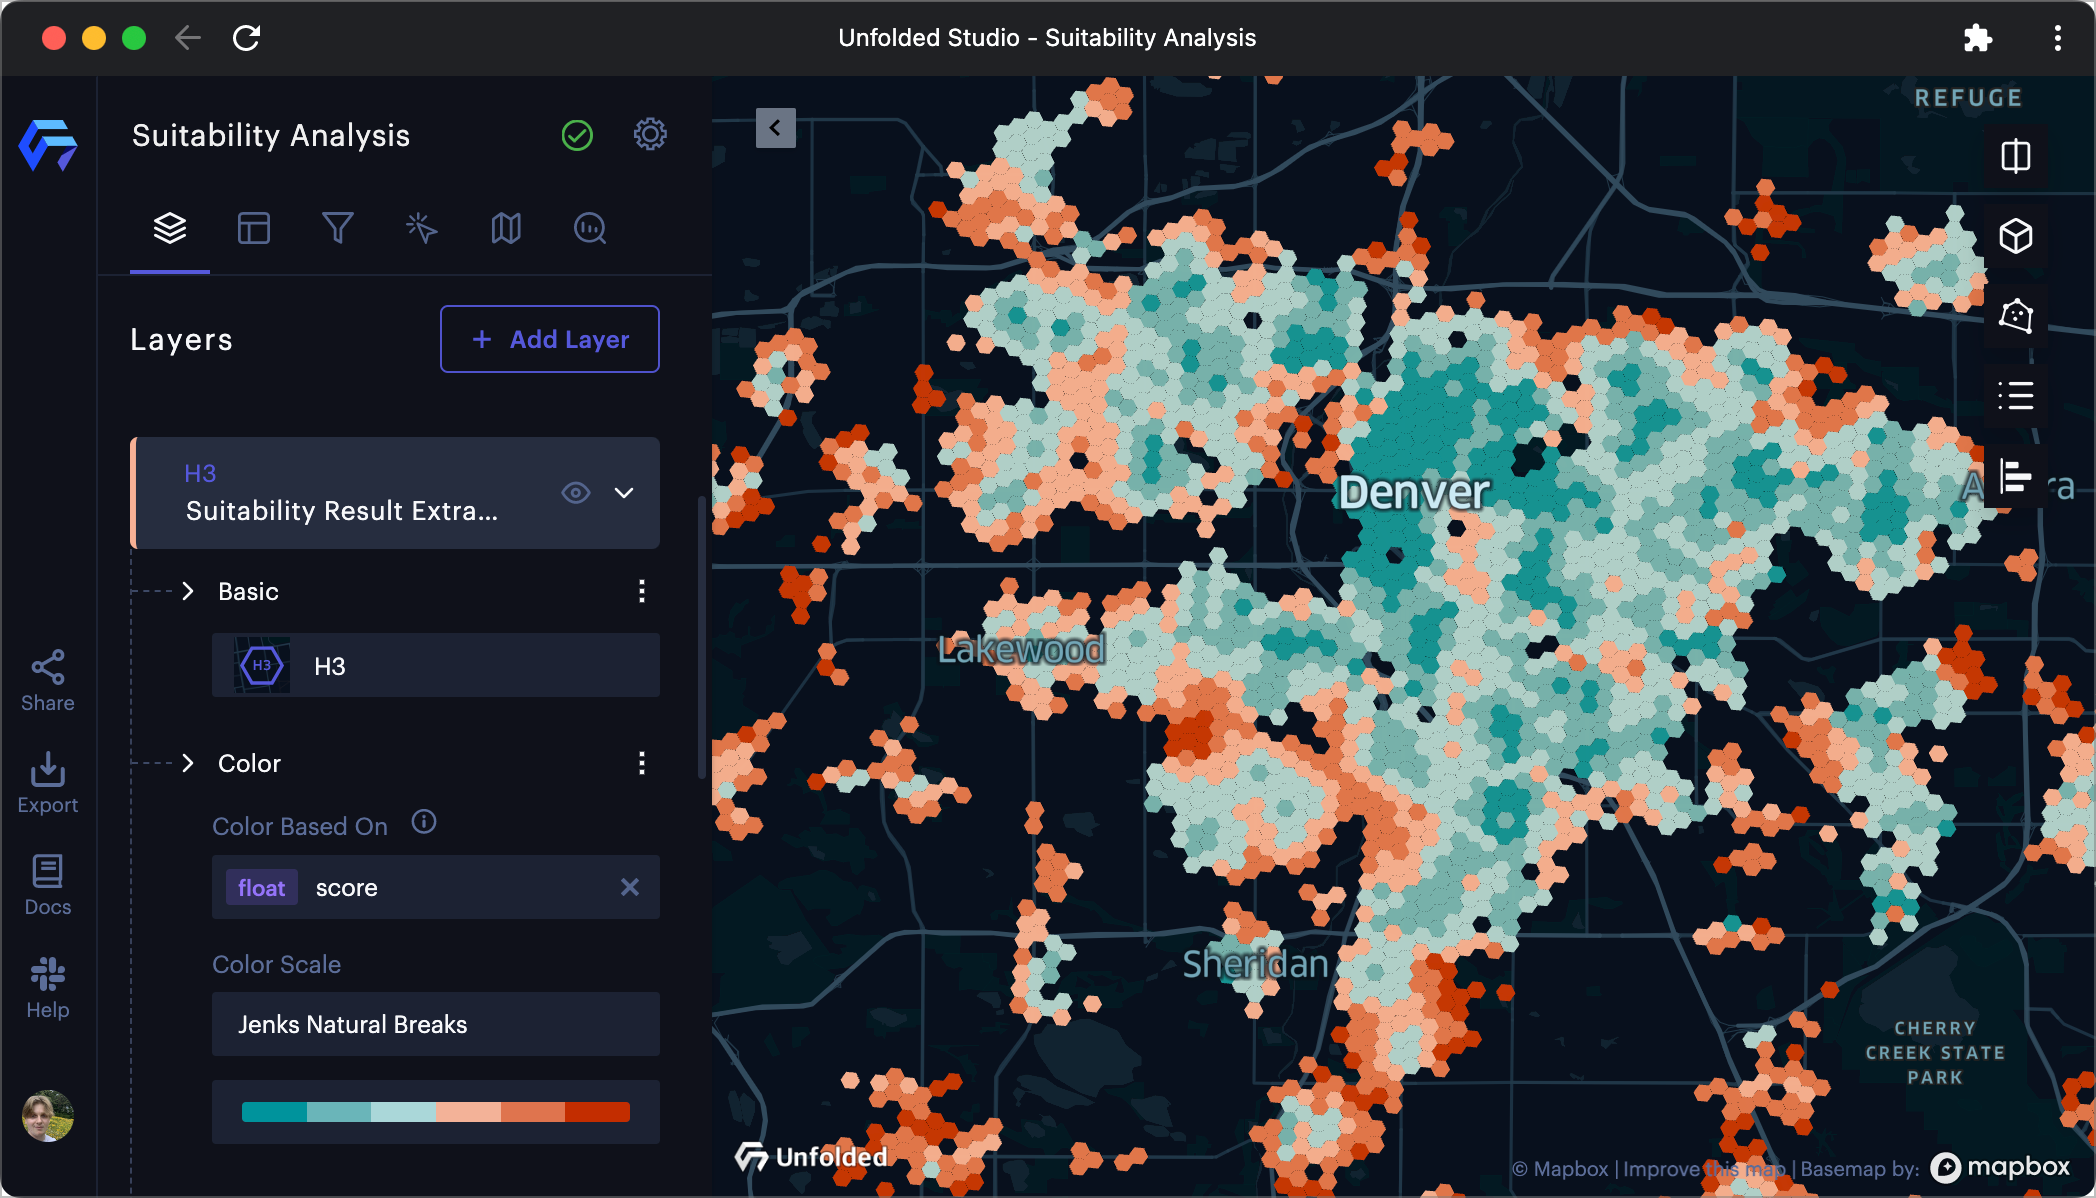
Suitability layer settings
The example above utilizes an H3 layer. To learn more about other geometry layer configuration settings, view your layer's page in the layer reference.
Color Configuration
By default, Studio visualizes the results on a 6-step color scale, with low scores represented in blue, and high scores represented in red. The colors are assigned with Jenks Natural Break, a method that aims to sort the values into a set of natural classes.
Configuring the color assignment is an excellent way to customize the visualization to fit your use case. In the below example, the color scale is changed to a 3-step color scale with custom breaks. Low scores are represented in blue, while high scores are represented in purple. (Note: in this example, low scores are preferred, indicating a shorter distance to the selected POI categories).
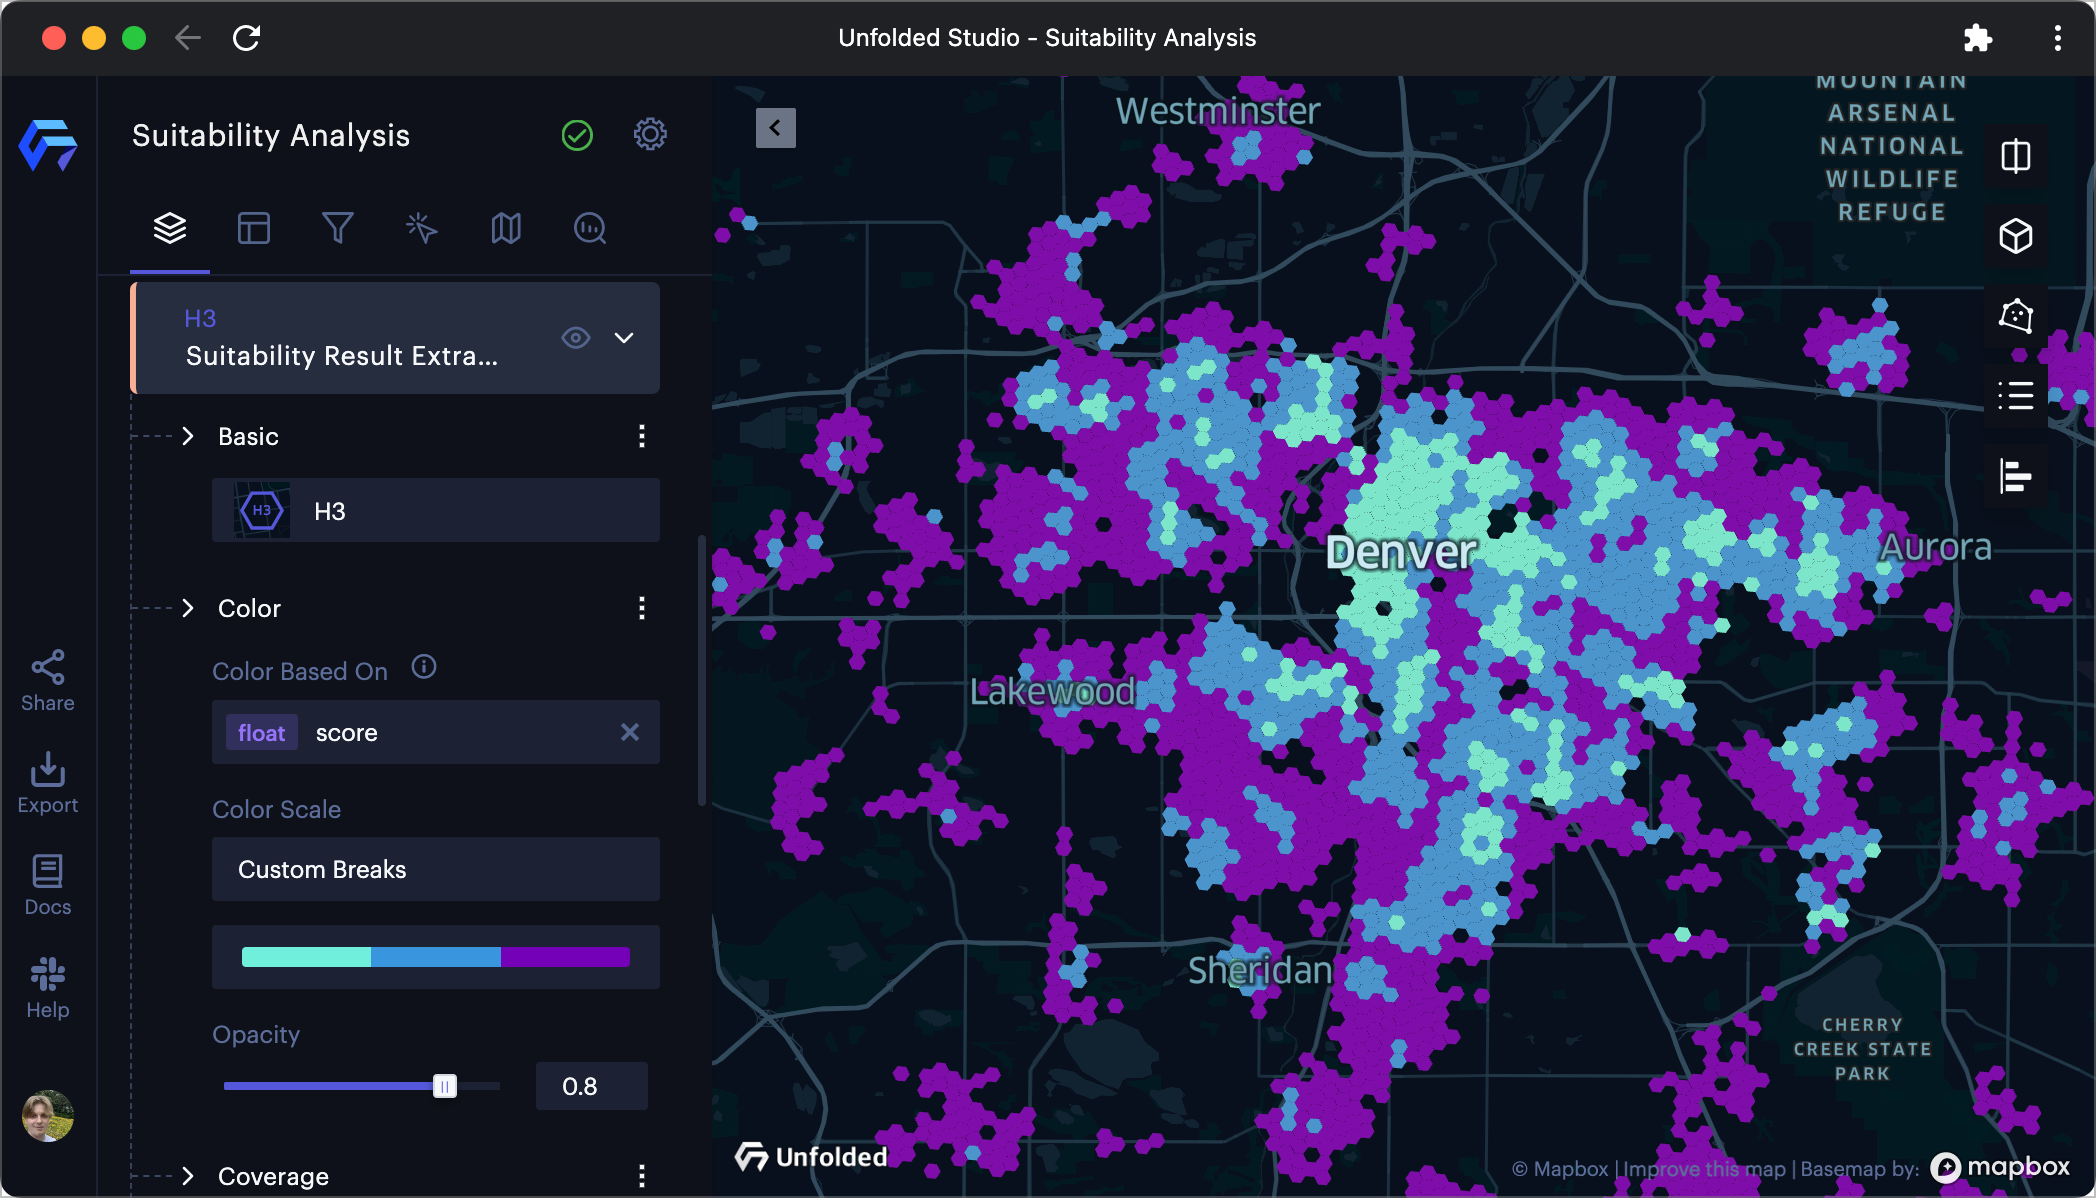
Suitability layers with a modified color scheme
Legend Configuration
Like any map, you can open the legend to display a color legend for the map. By default, the legend will display the score range for each color on your color scale. While this information may be useful for many users, you may want to assign a qualitative definition for each range.
Click on any number in the legend then type a new label. In the below example, the color scale is represented by Suitable, Meets most criteria, and Not Suitable.
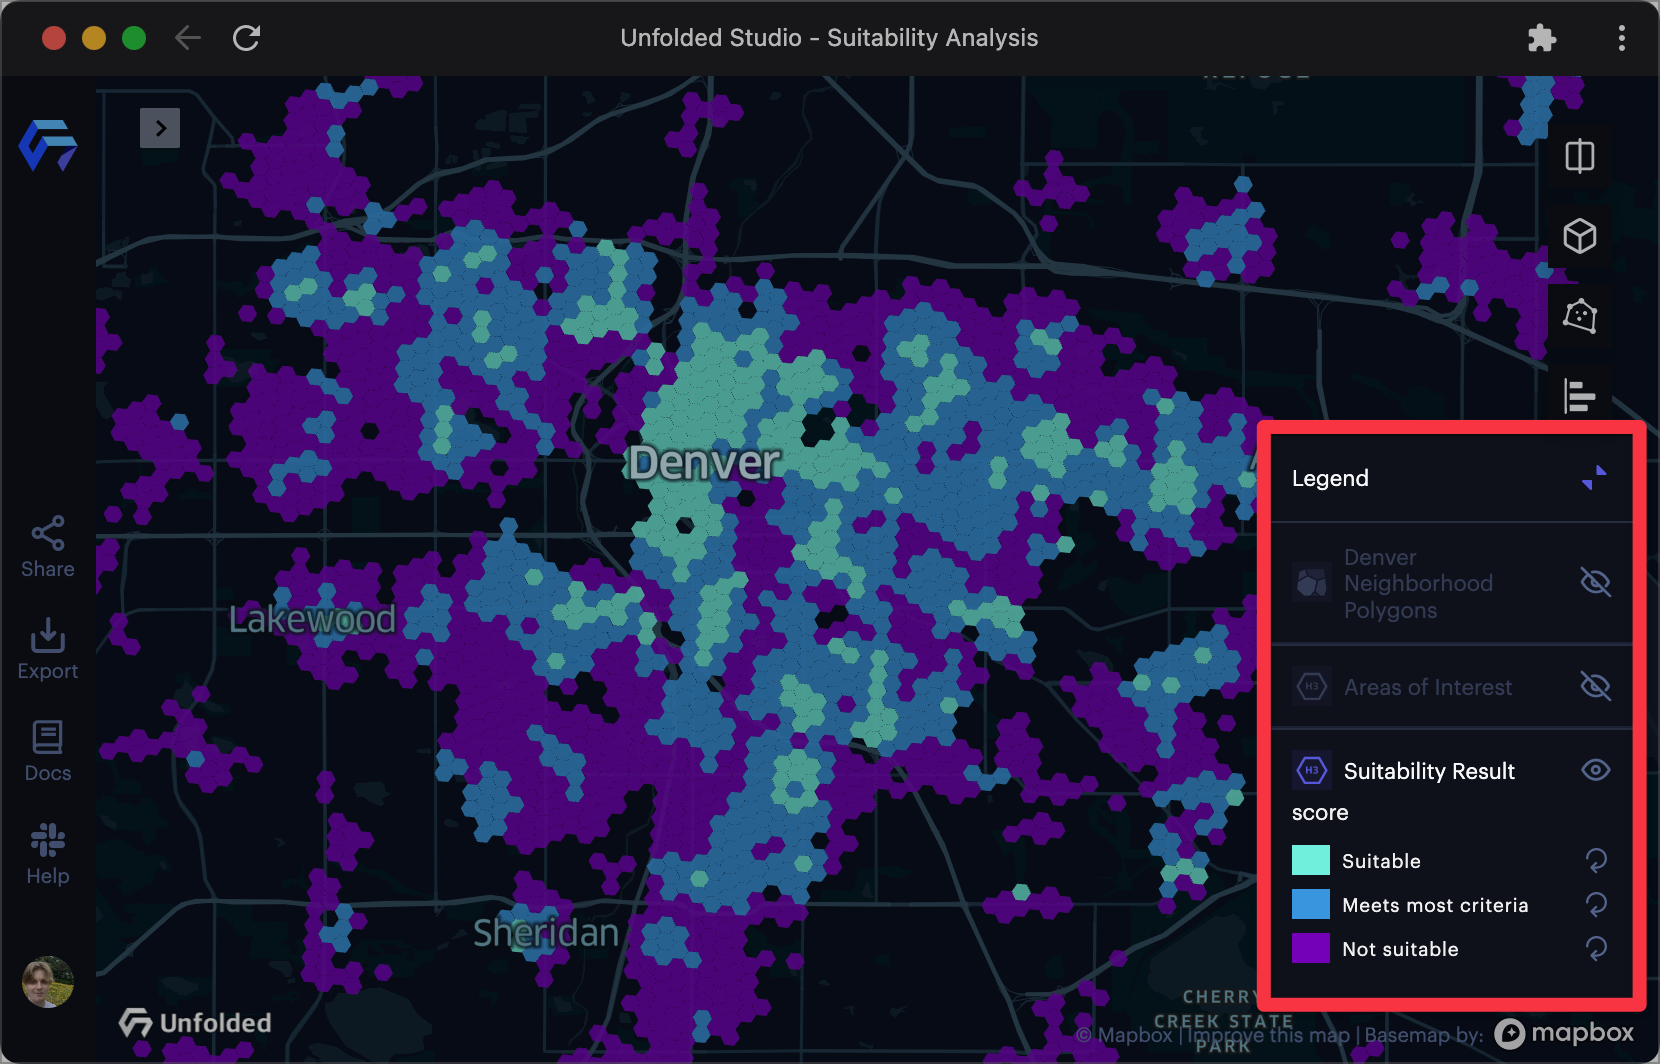
Legend modified with qualitative labels
Compare Analyses
You may also want to compare two different suitability analyses using one of Studio's split maps mode. In this view, you can compare your map using different suitability configuration parameters.
To compare two suitability analyses from the same dataset:
1. Generate a new suitability analysis using the original dataset.
2. Duplicate the existing suitability layer to quickly copy its configuration, then select the new dataset in the layer configuration.
3. Enable a split-map view, then select a layer to appear in both the left and right maps.
Remarks
Ongoing Development
The Suitability Analysis module is undergoing continued development. Visit our community Slack channel, or contact us directly via email for any inquiries regarding this module.
Updated about 2 years ago
