
Layer Glossary
| Layer Type | Description | Layer Preview Image |
|---|---|---|
3D Layer | 3D layer displays 3D models on map by using latitude and longitude coordinates. | 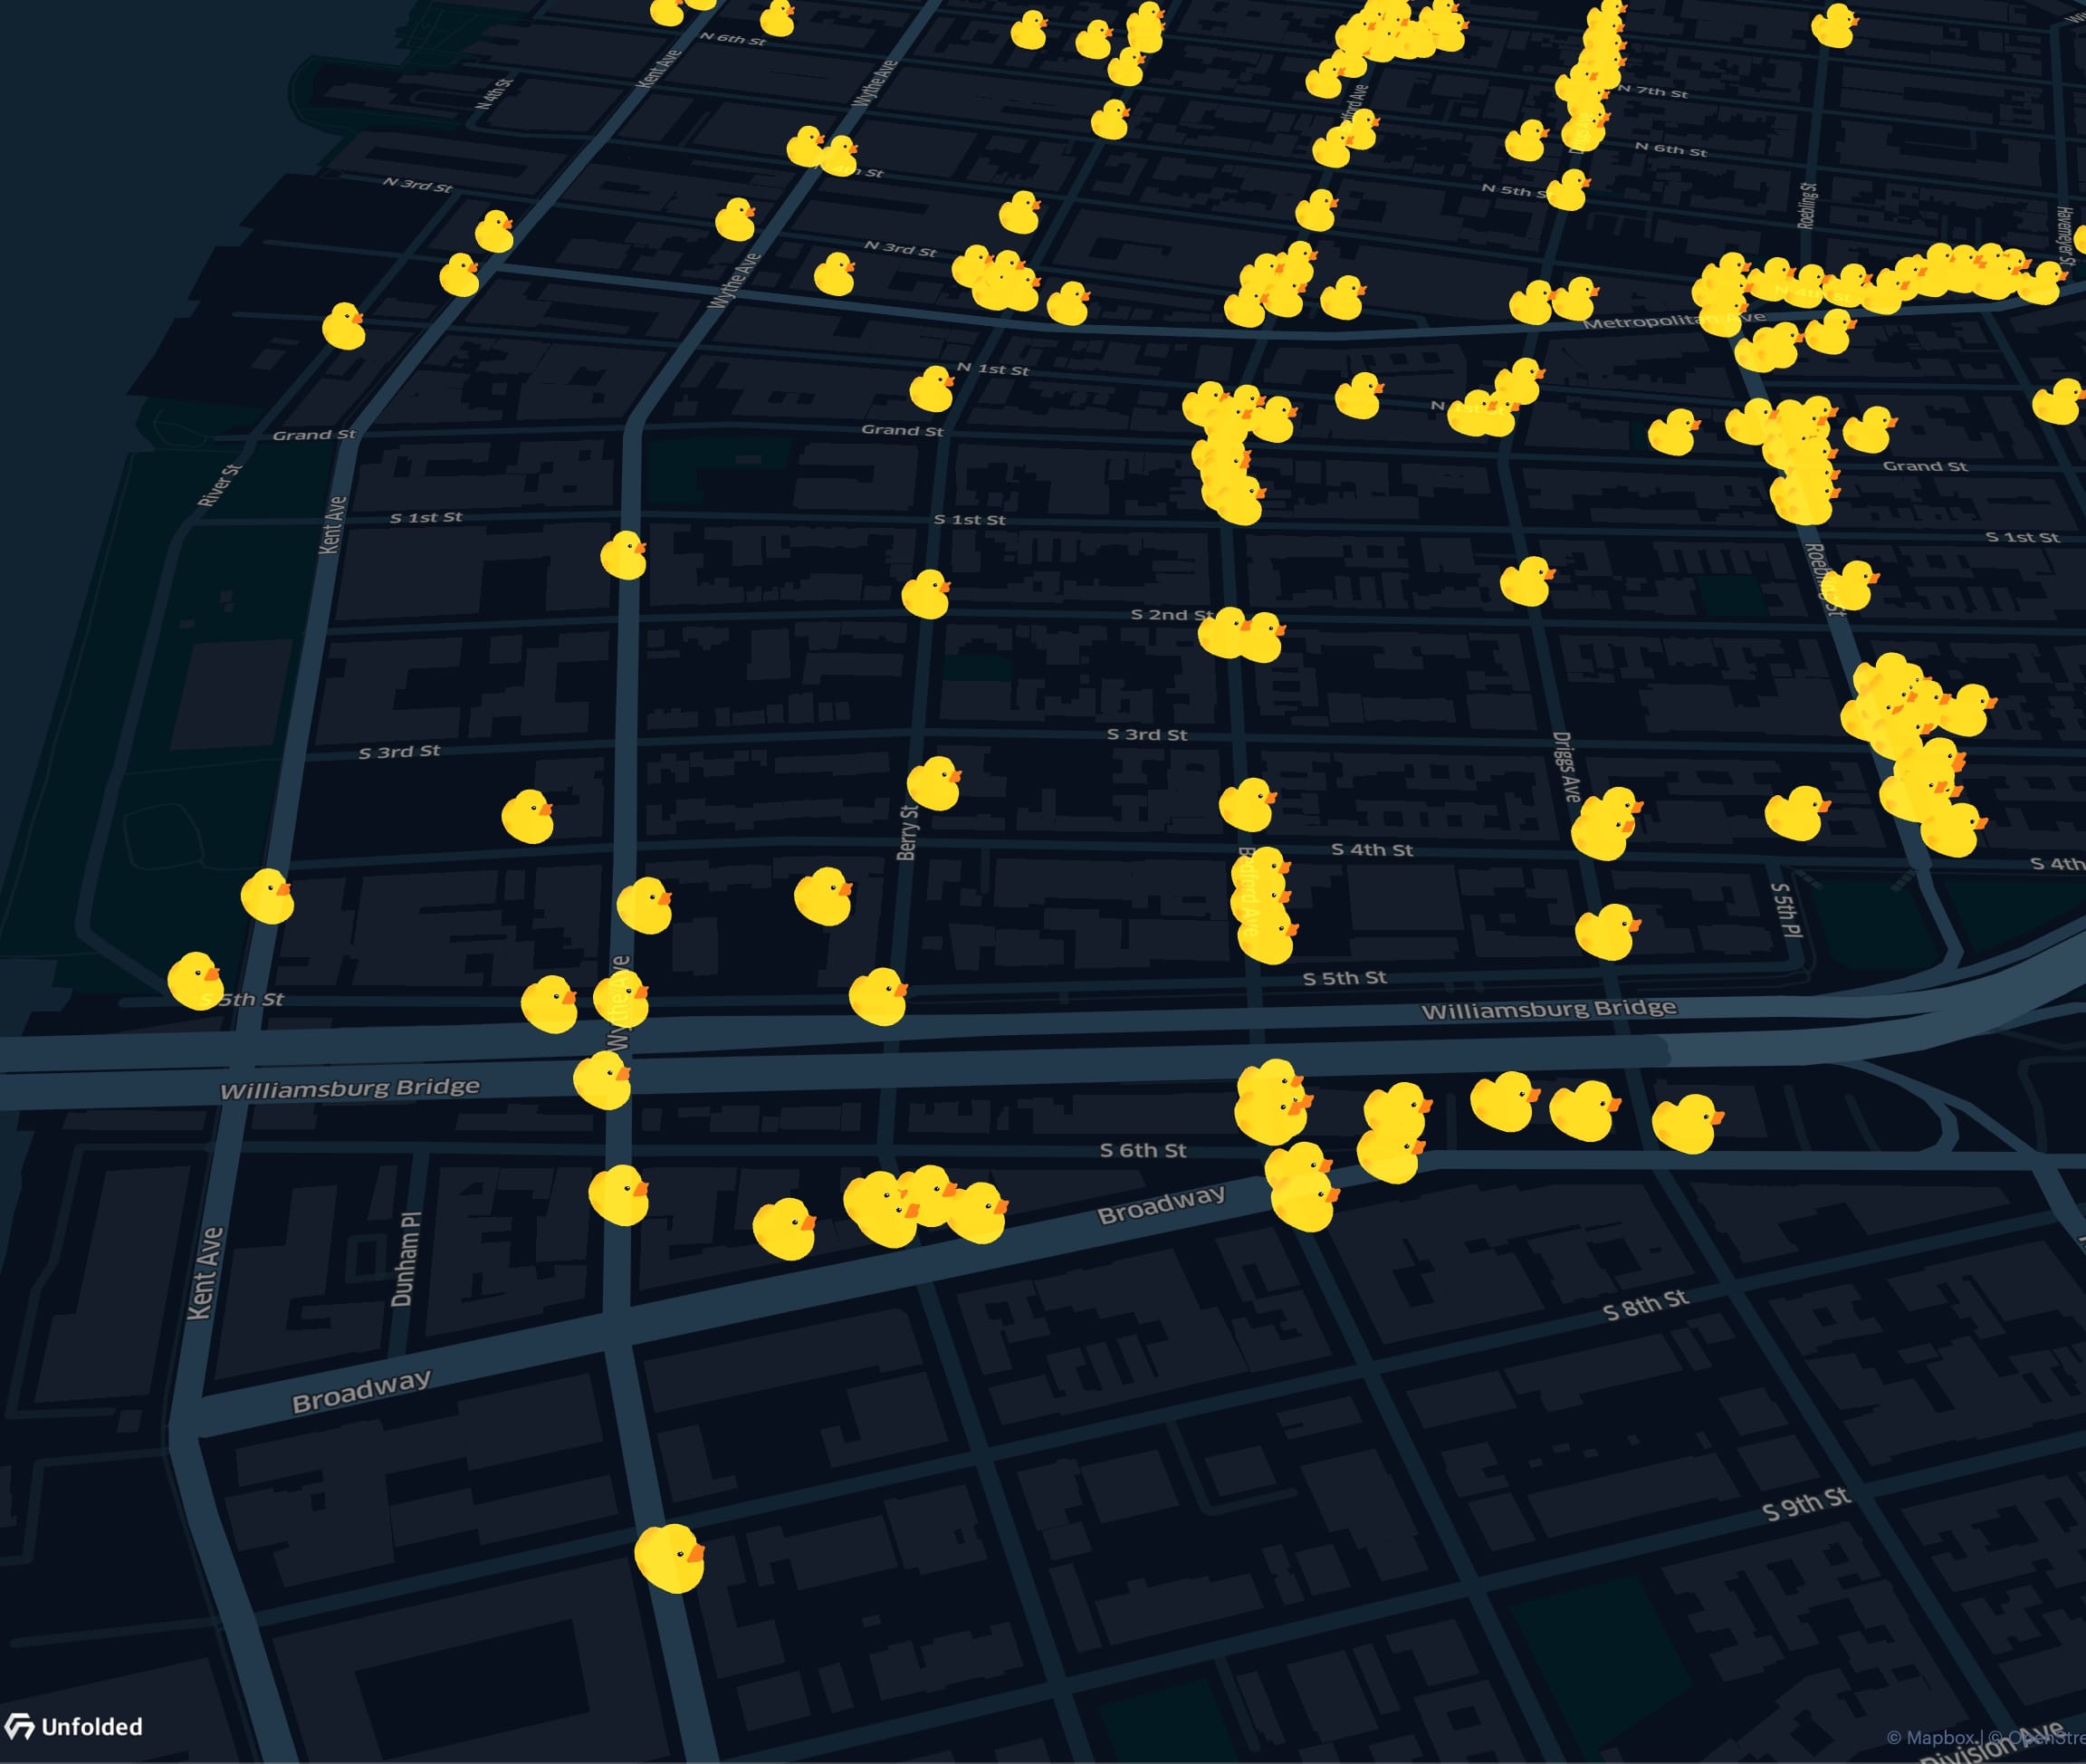 |
Arc Layer | Arc layers are useful for visualizing the distance between two points as well as comparing distances in 3D. | 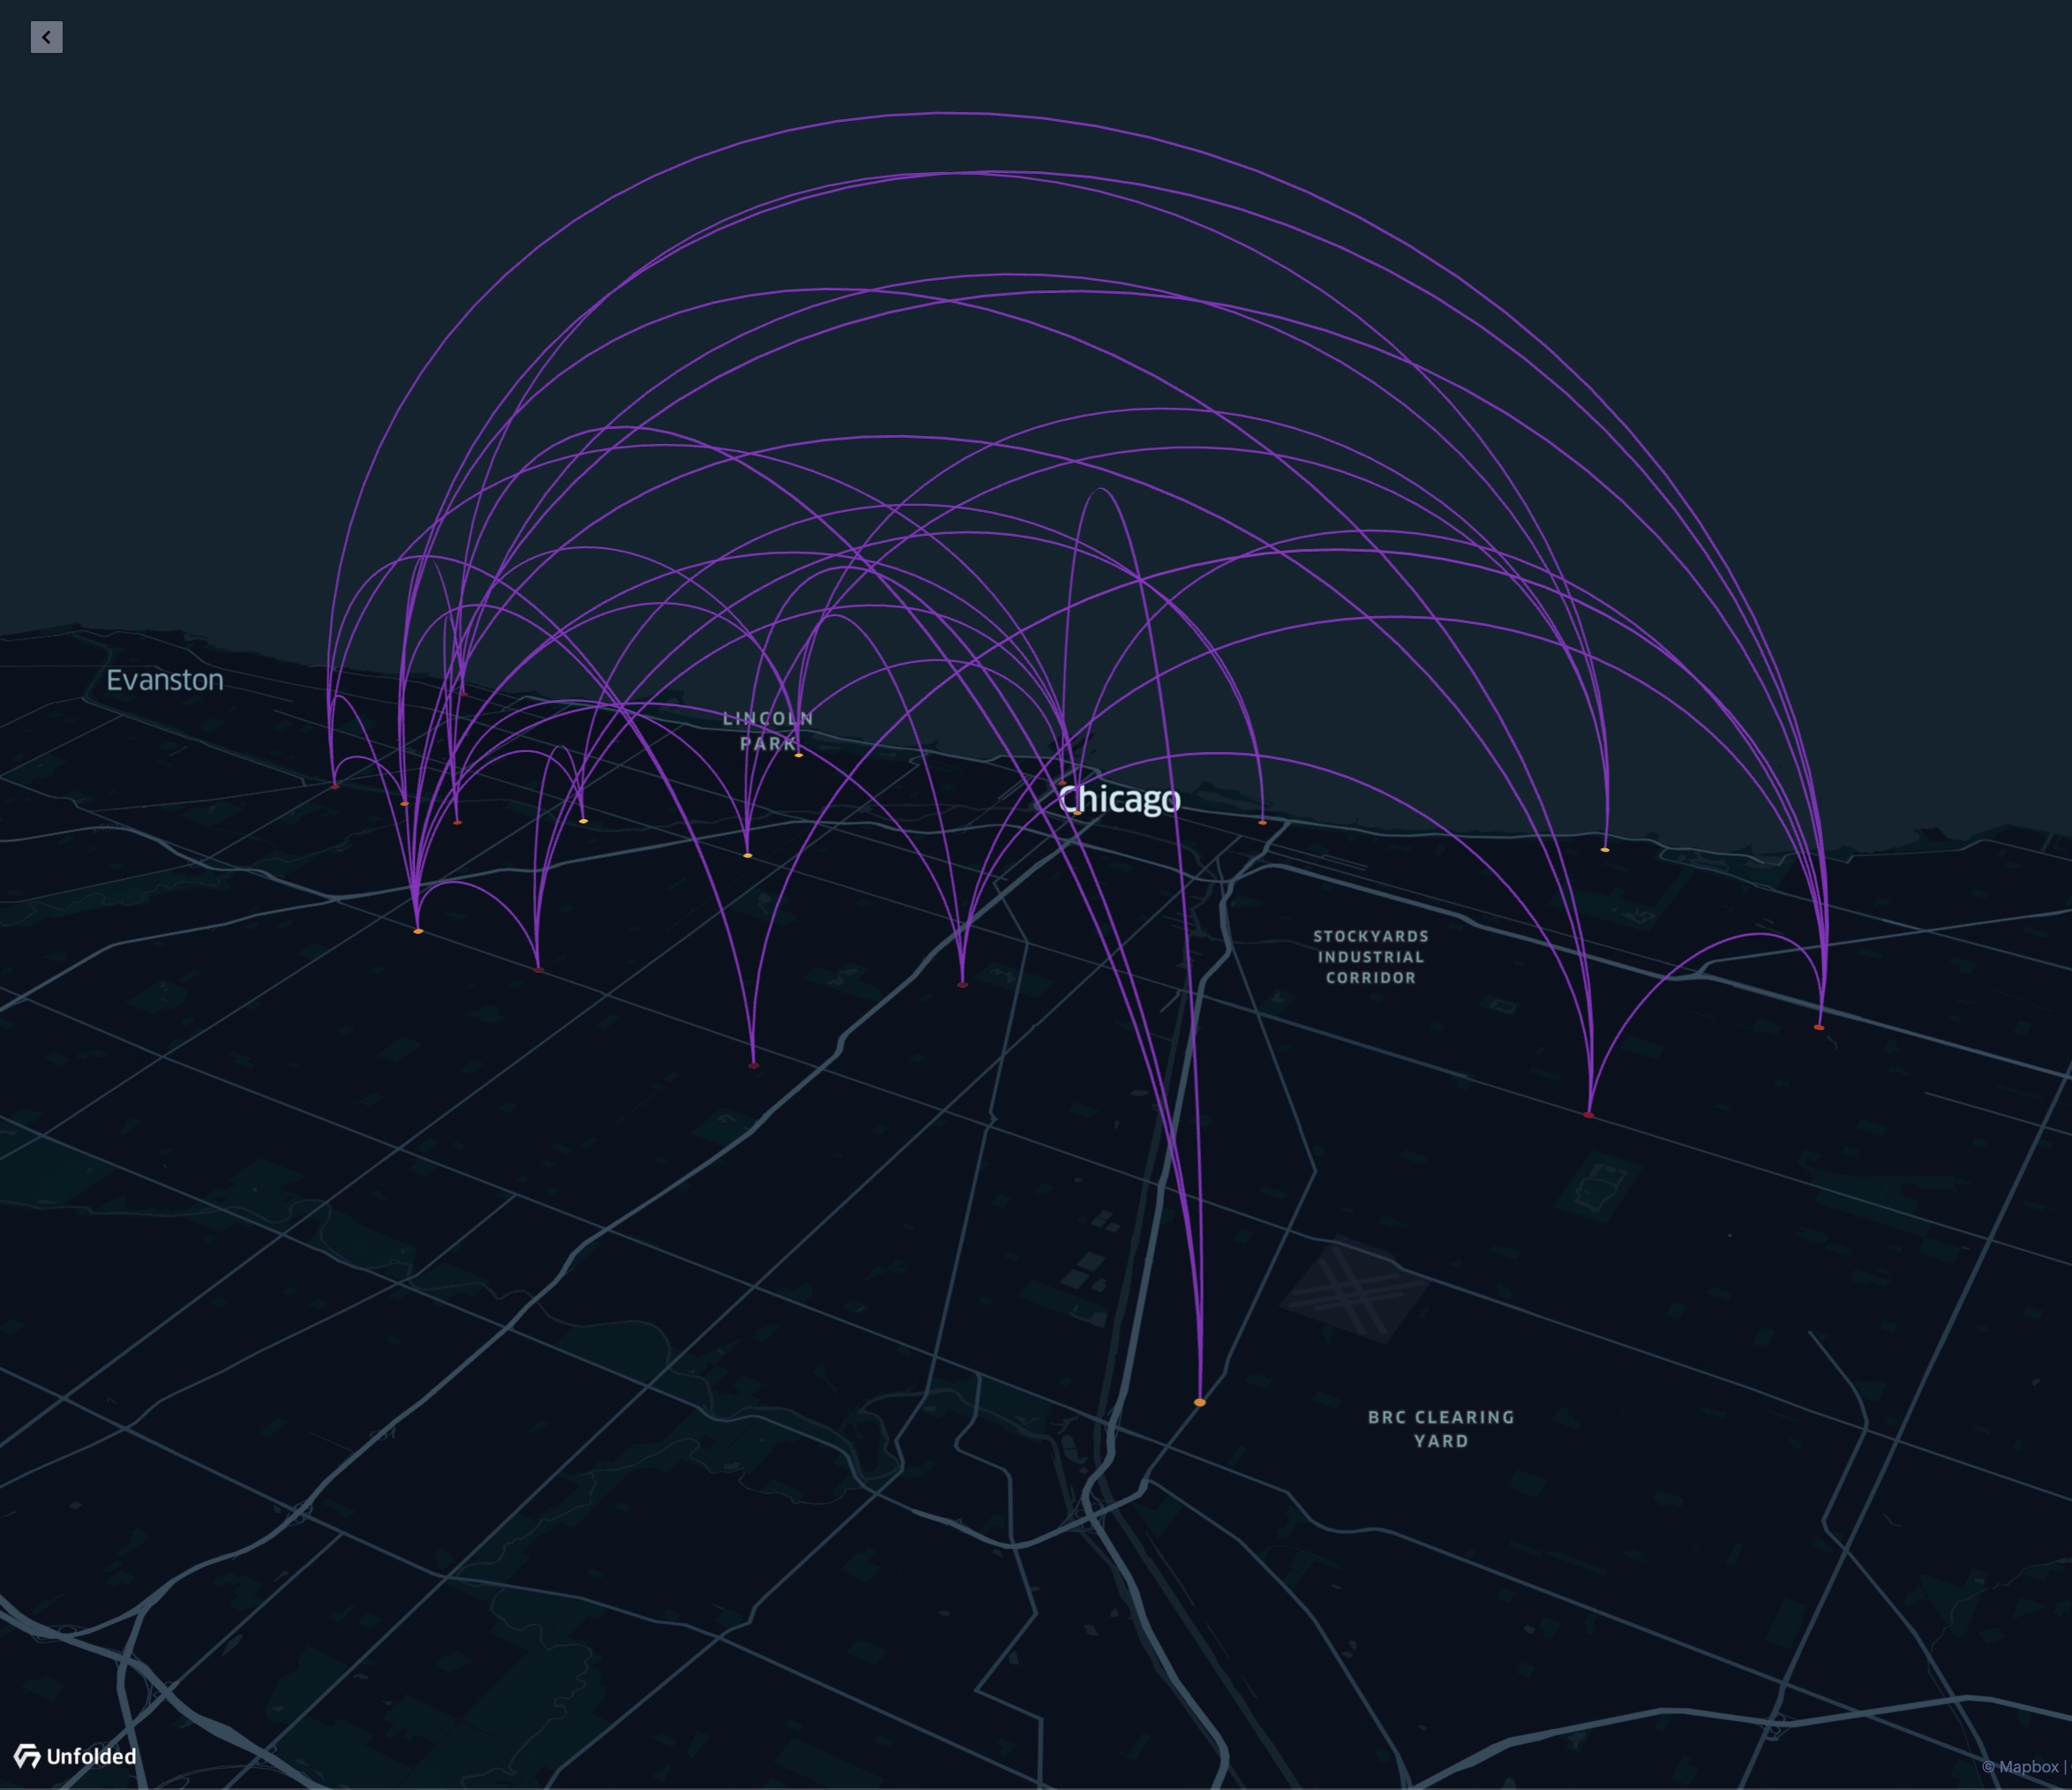 |
Cluster Layer | Cluster layers visualize aggregated data based on a geospatial radius. | 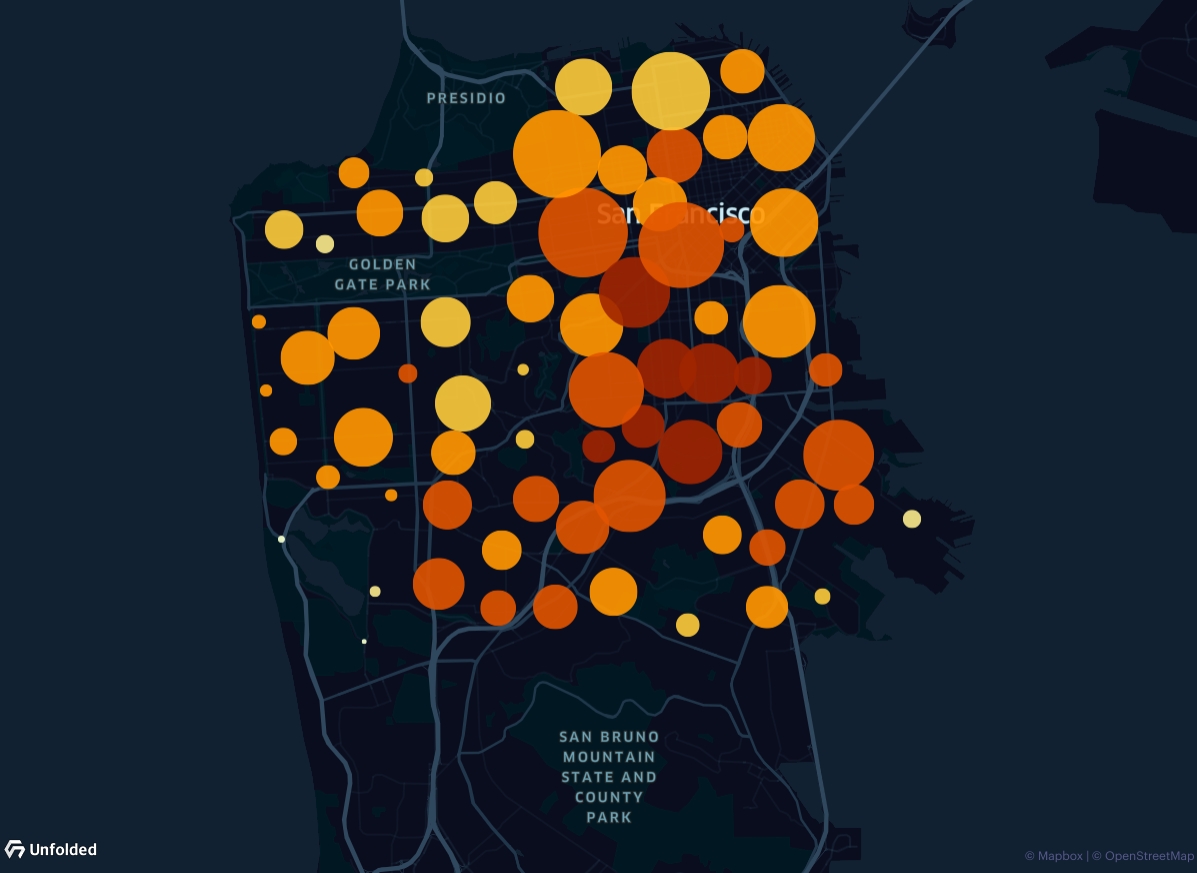 |
Flow Layer | Flow layers visualize origin-destination movement patterns between latitude and longitude coordinates. | 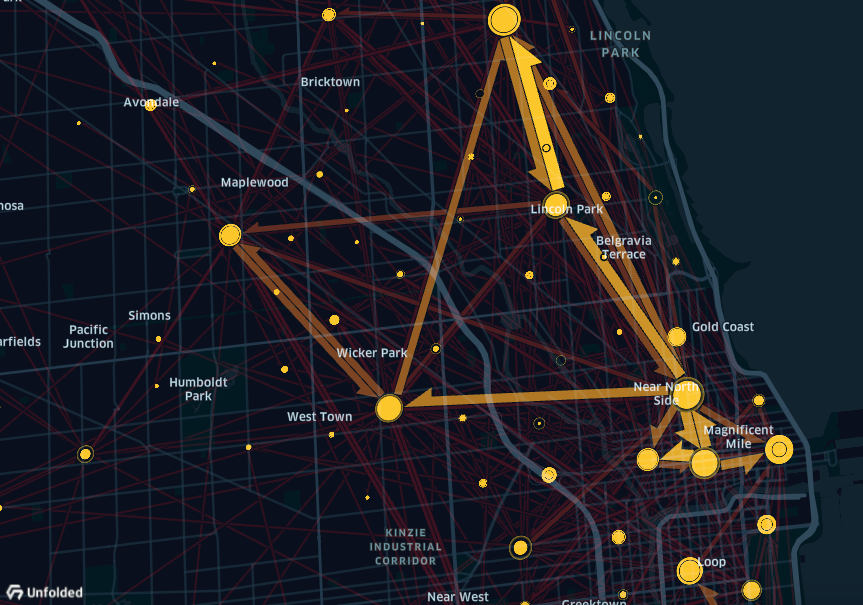 |
Geojson/Polygon Layer | Polygon layers can display either paths, polygons or points. For example, a path layer can display data like trip routes. | 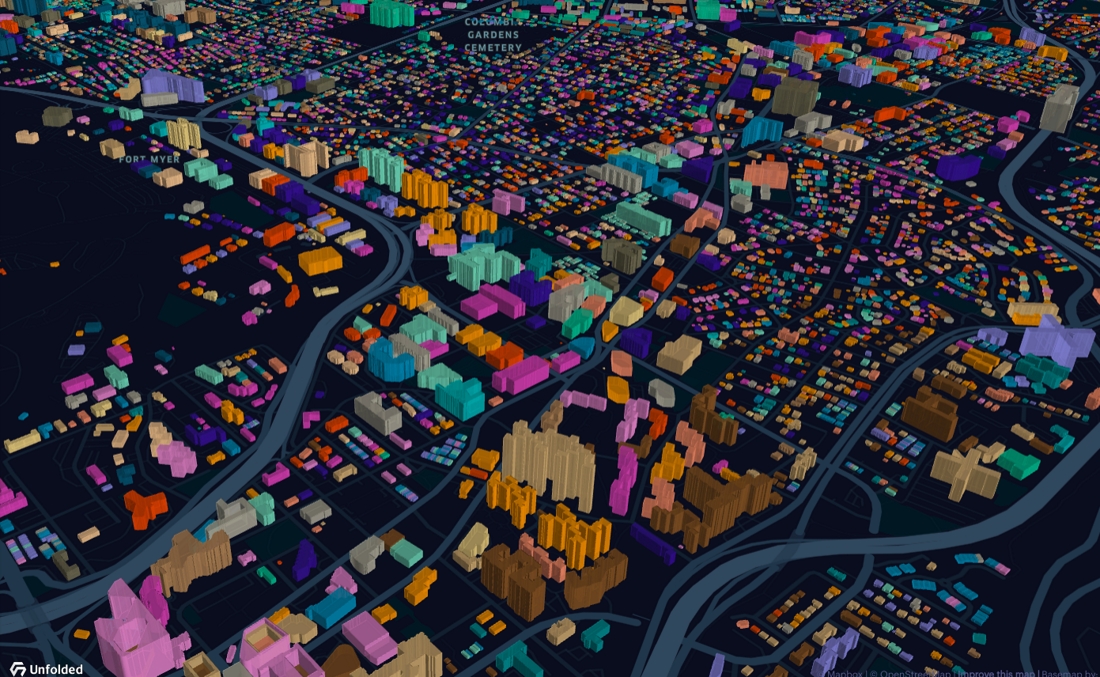 |
Grid Layer | Grid layers are similar to heatmap layers. They show the density of points. | 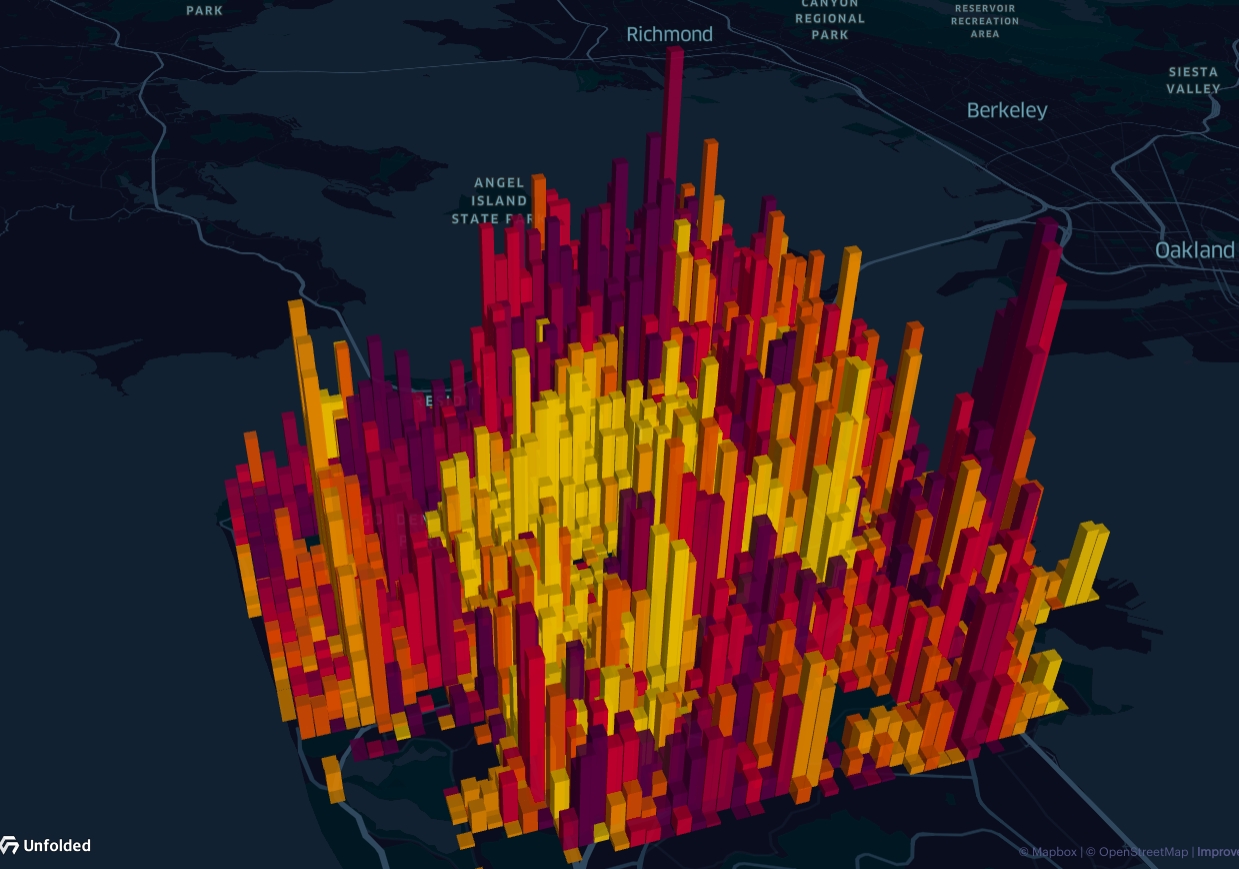 |
H3 Layer | H3 layers visualize spatial data using H3 Hexagonal Hierarchical Spatial Index. | 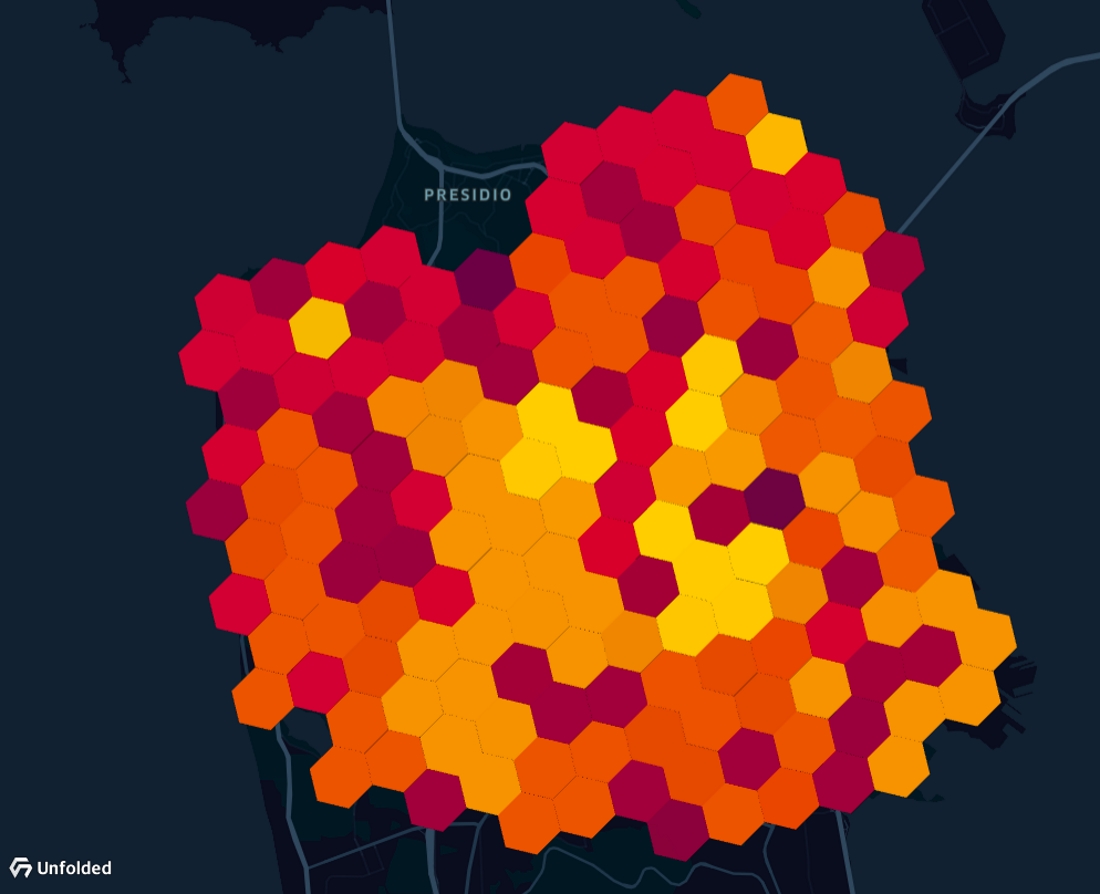 |
Heatmap Layer | Heatmap is a graphical representation of data in which values are represented as colors. | 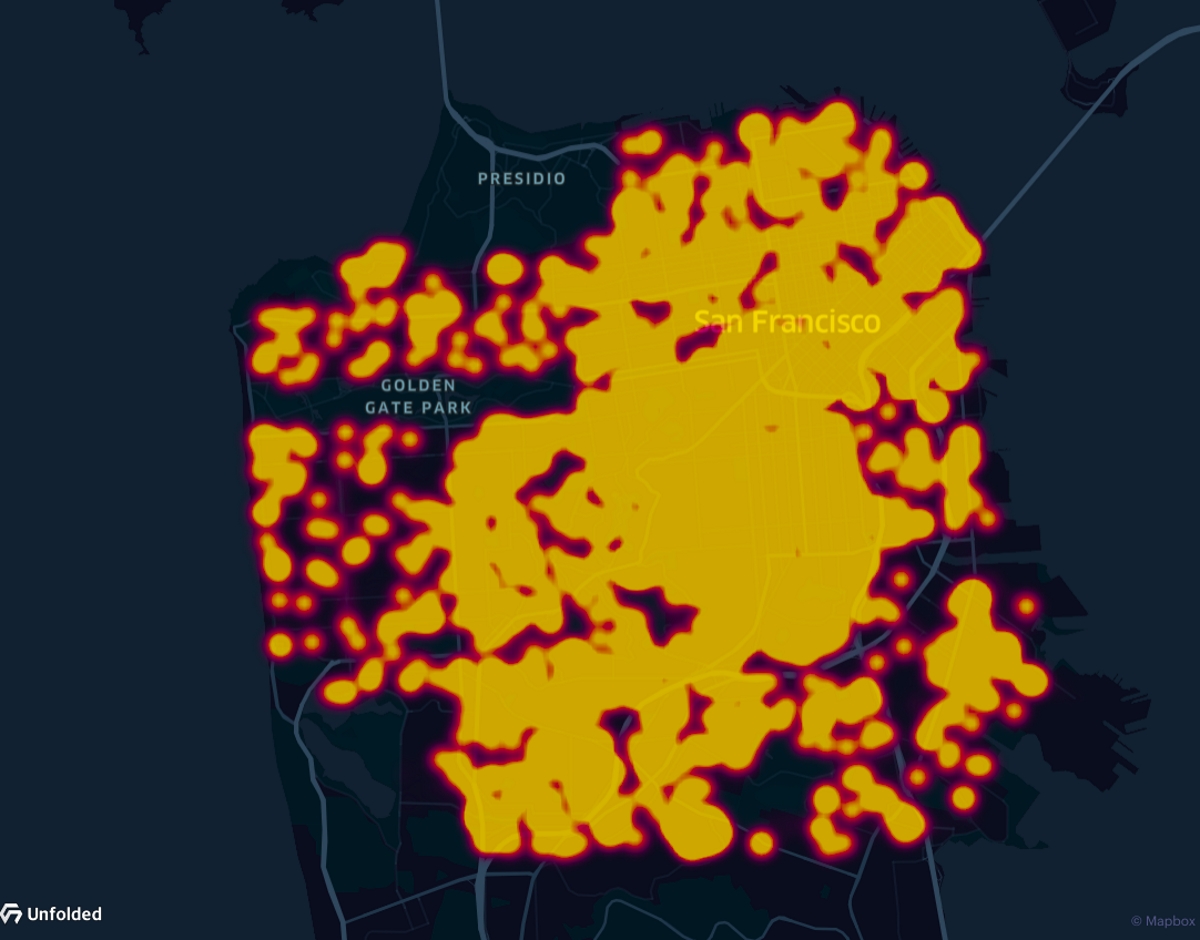 |
Hexbin Layer | Hexbin layers aggregate points into hexagons. The counts can be represented through color and/or height. | 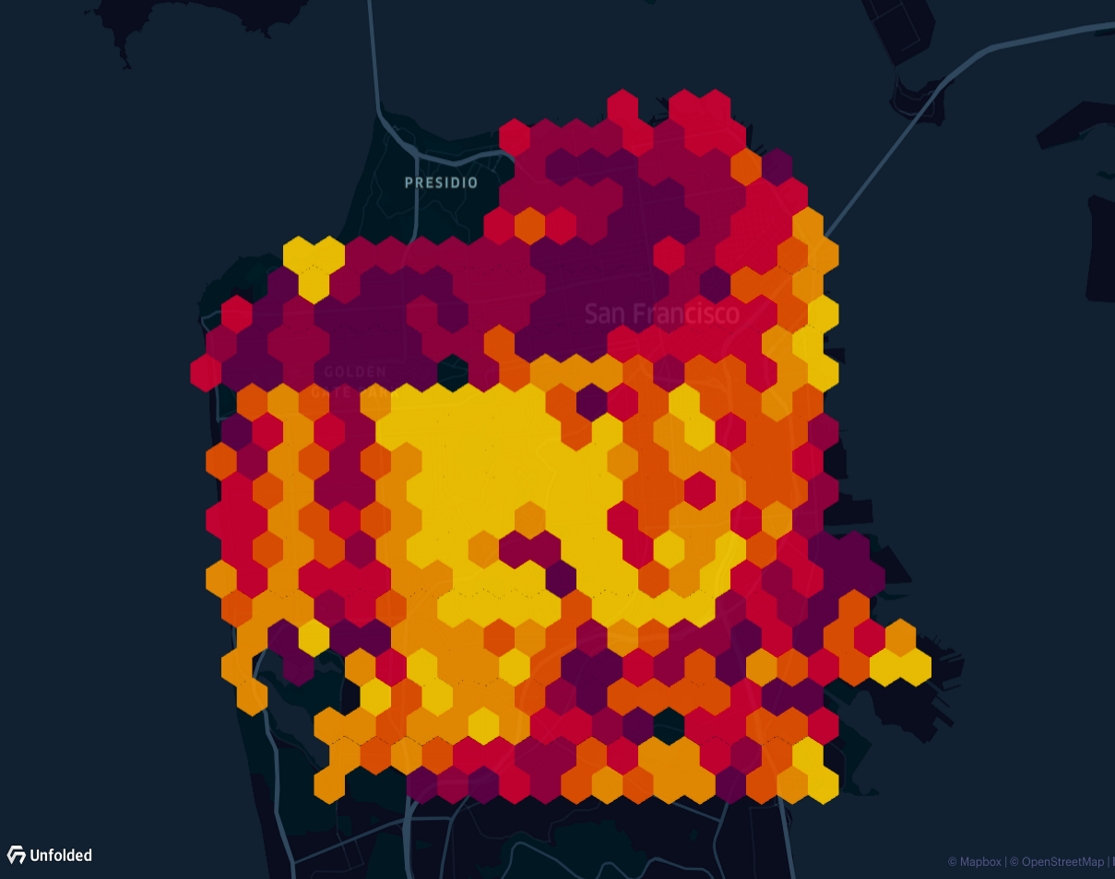 |
Hex Tile Layer | Hex Tile layers use Foursquare's proprietary Hex Tile tiling system. | 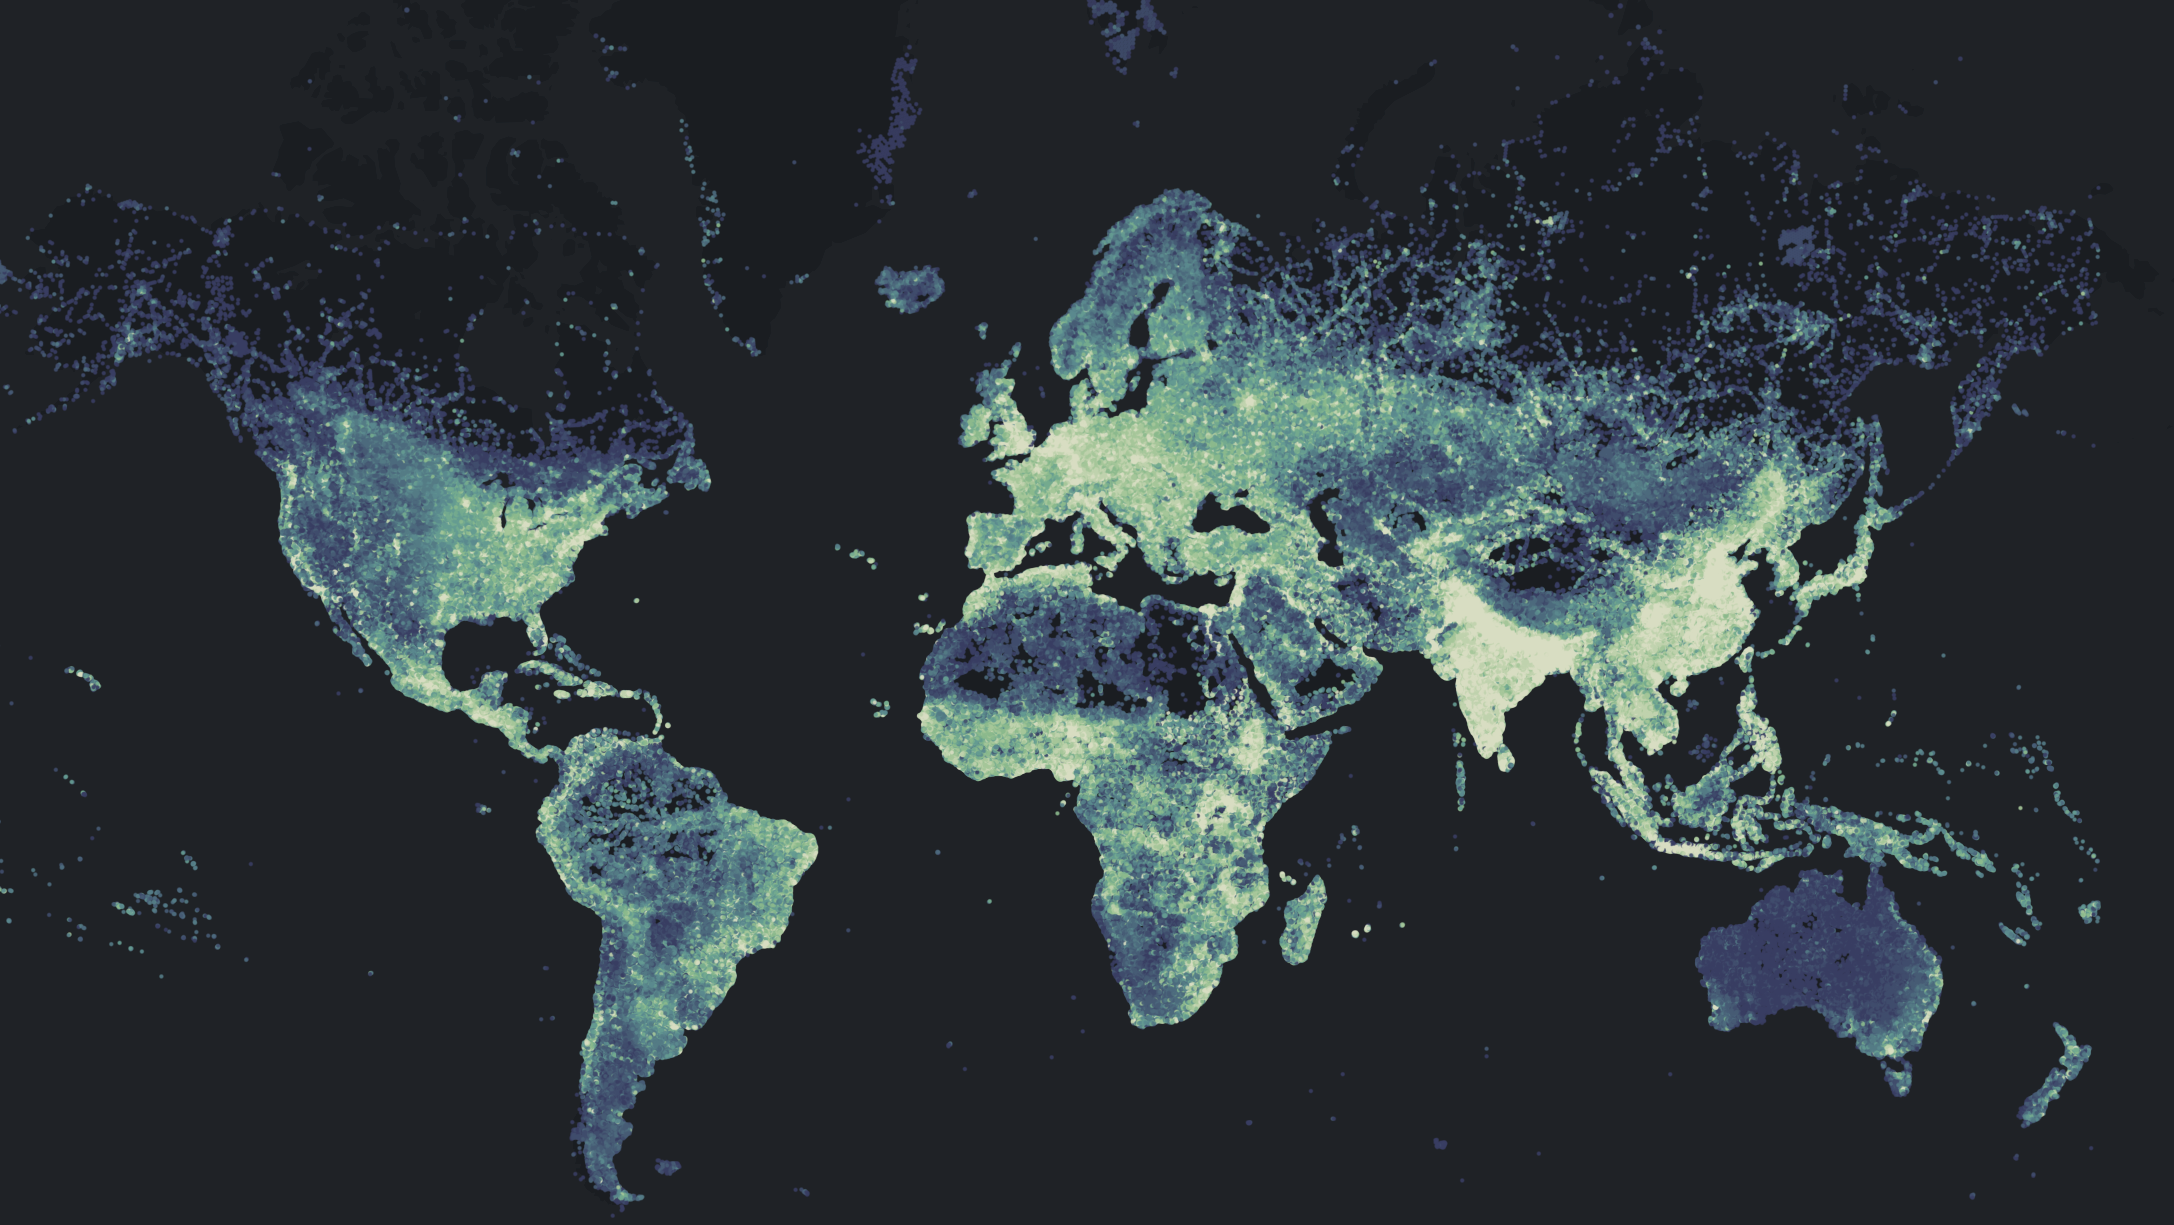 |
Icon Layer | Icon layers are a type of point layer. They allow you to differentiate between points by assigning icons to points based on a field. | |
Line Layer | Line layers are the 2D version of arc layers. Both draw a line between two points to represent distance,but, in a line layer, the drawing lies flat on the map. | 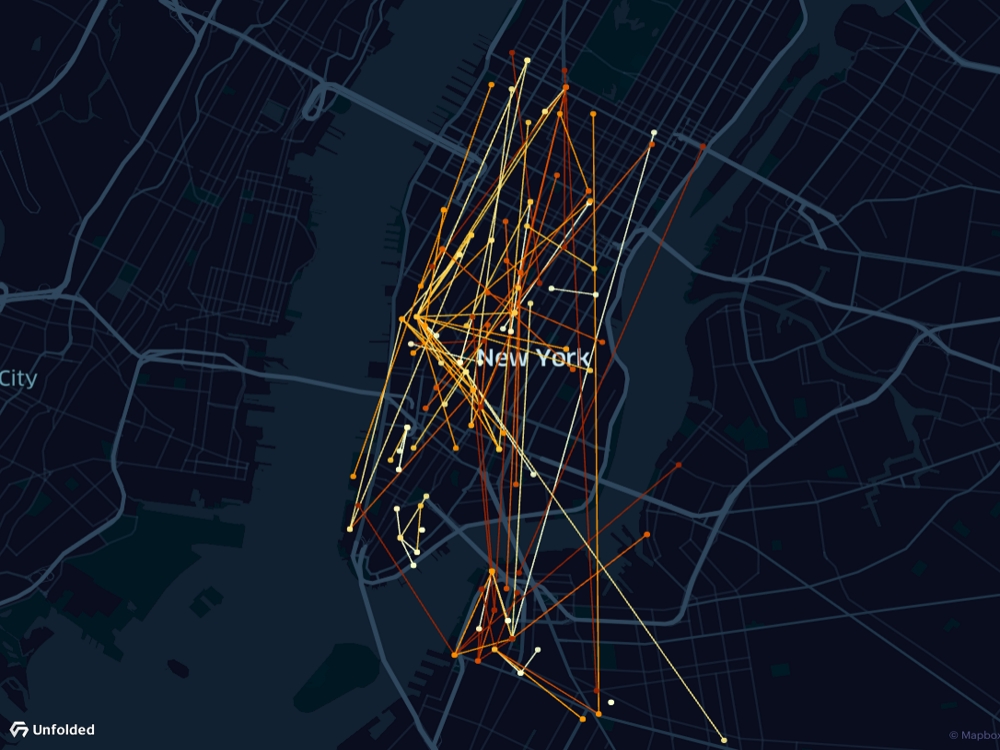 |
Point Layer | Point layers draw points for a given event or object based on its latitude and longitude. | 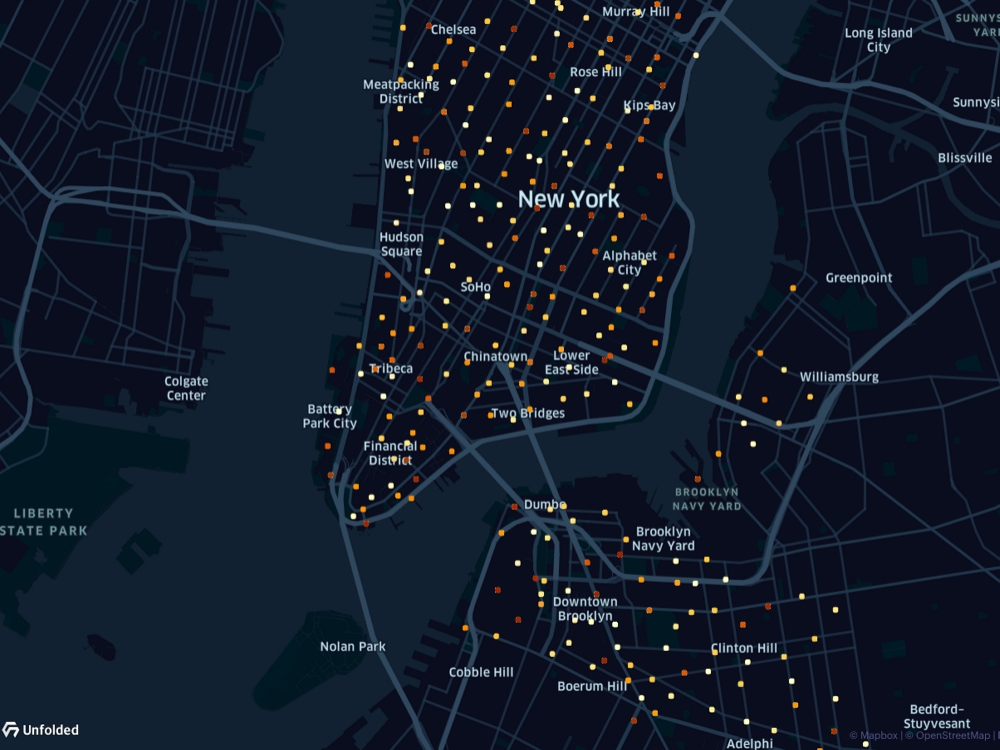 |
Raster Layer | Raster layers show aerial photographs, imagery from satellites, or even scanned maps. | 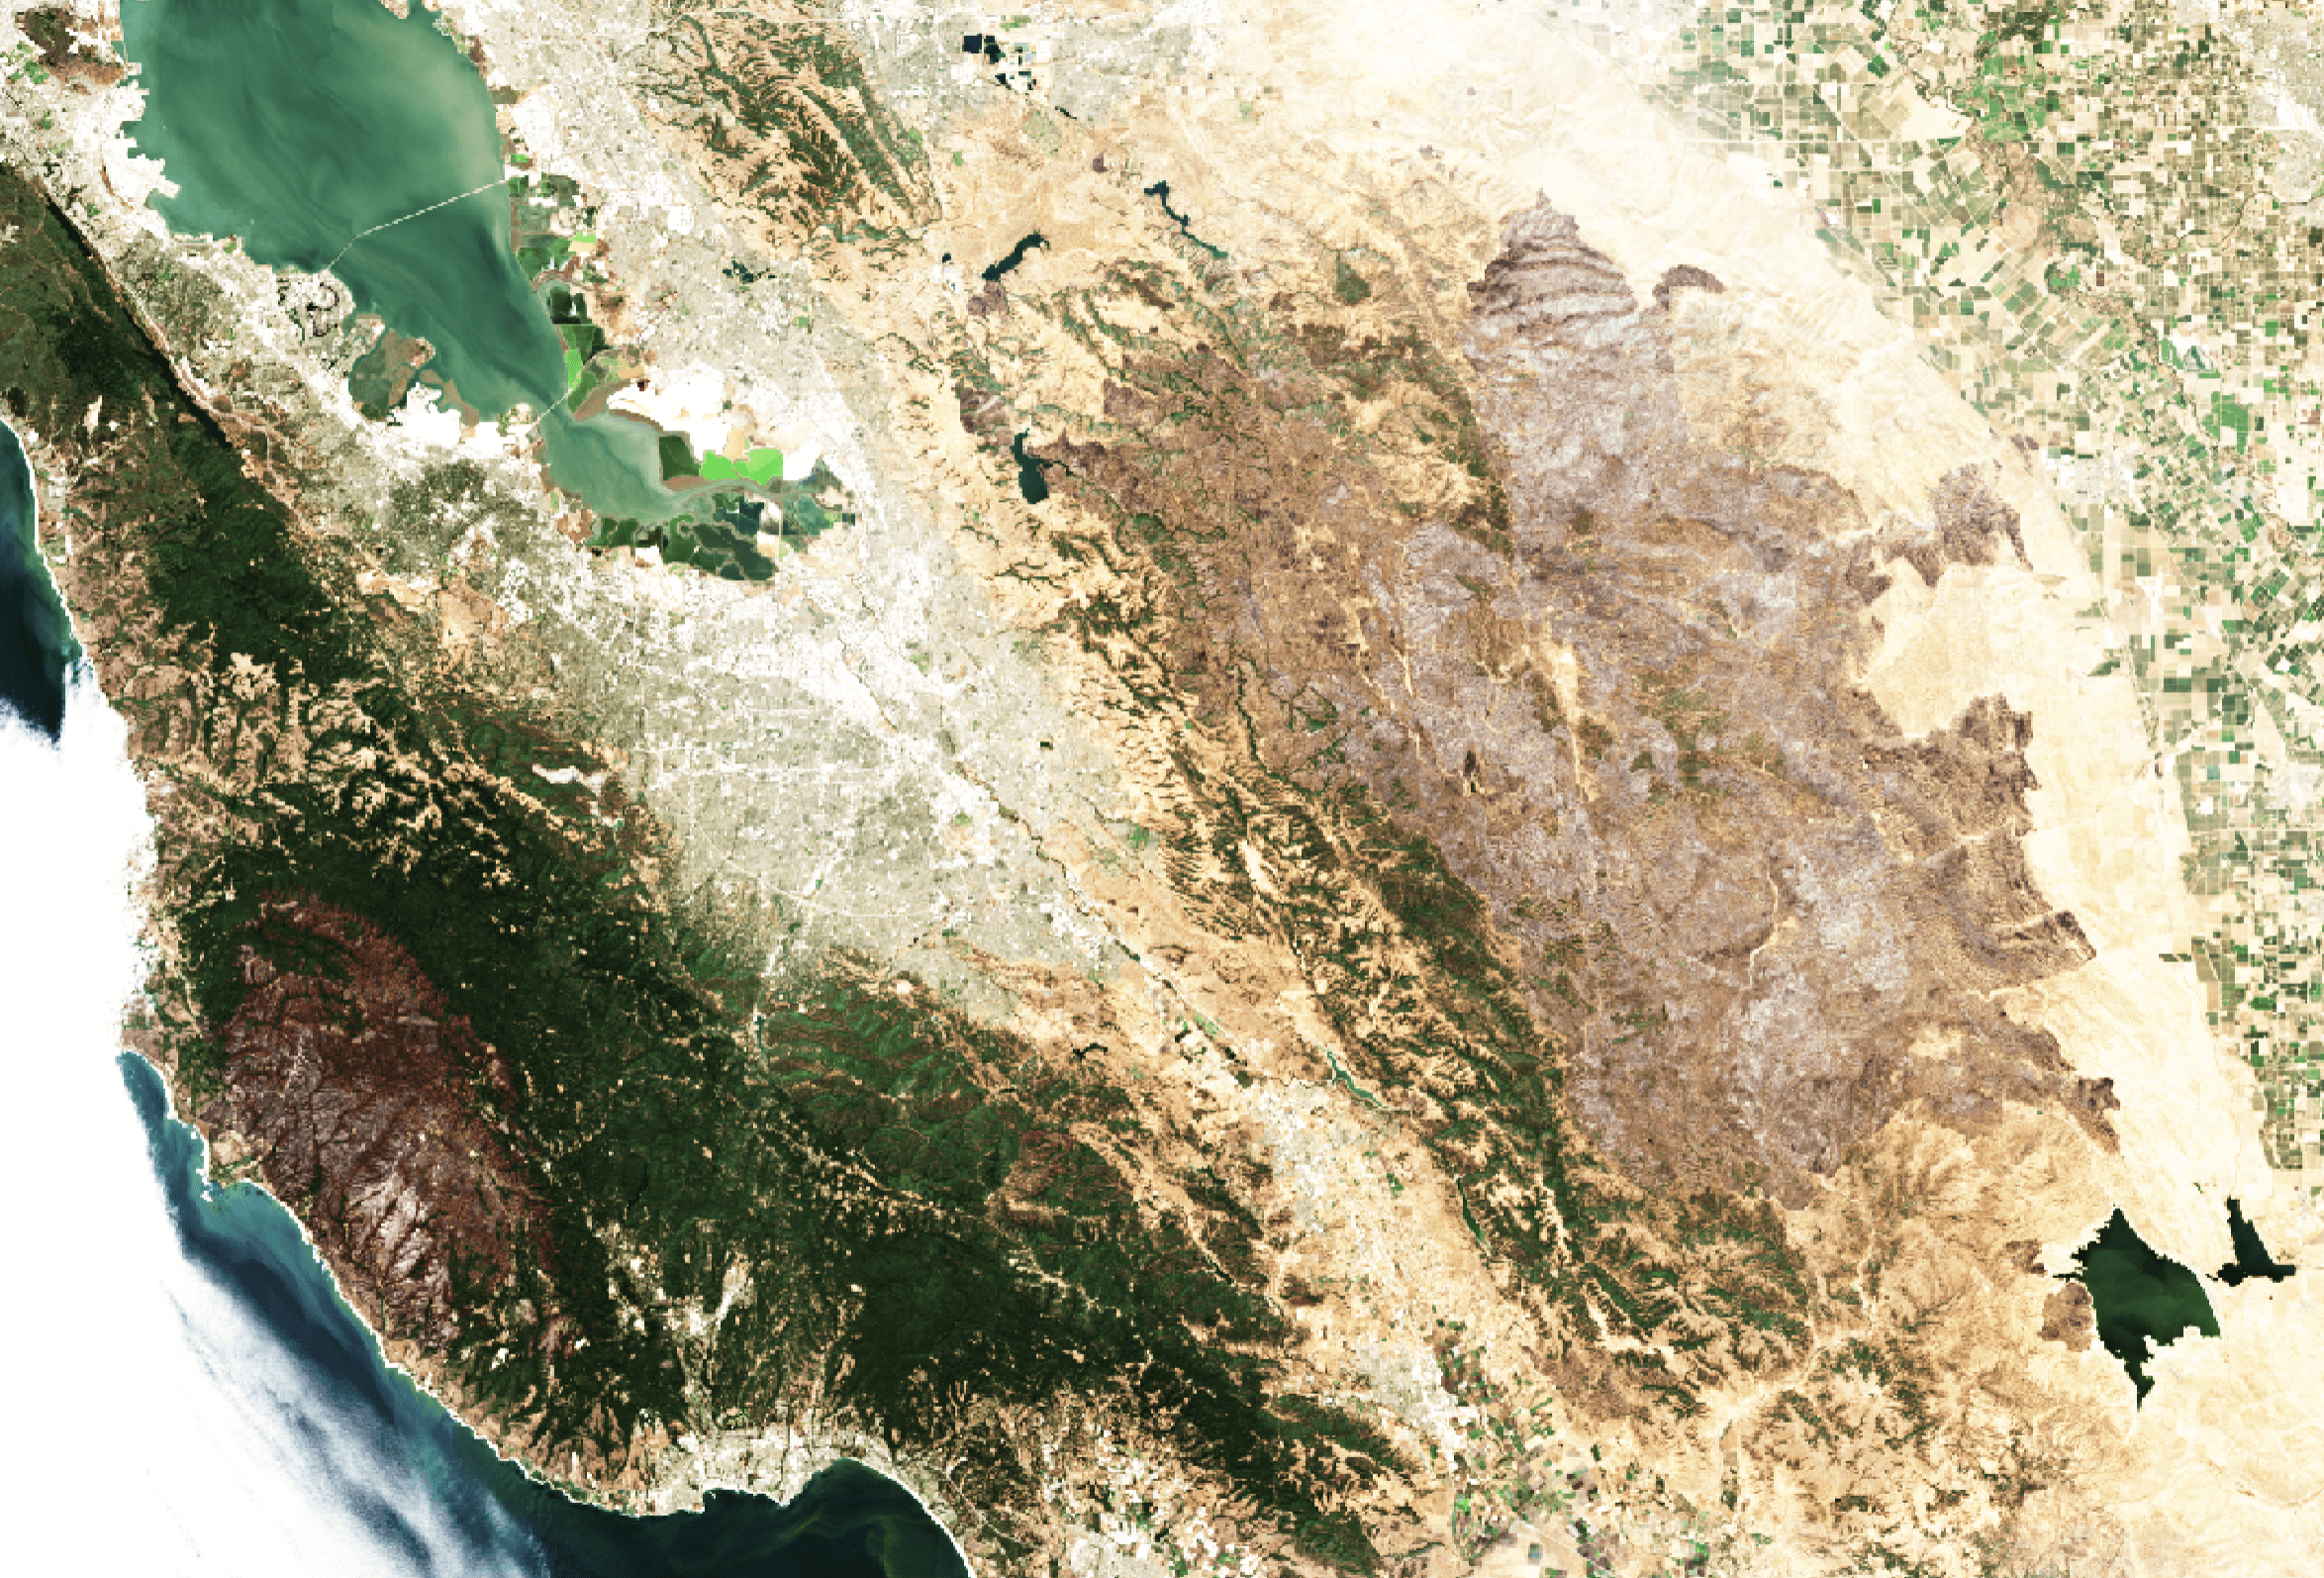 |
S2 Layer | To use S2 layers, you need to assign a column containing S2 tokens. | 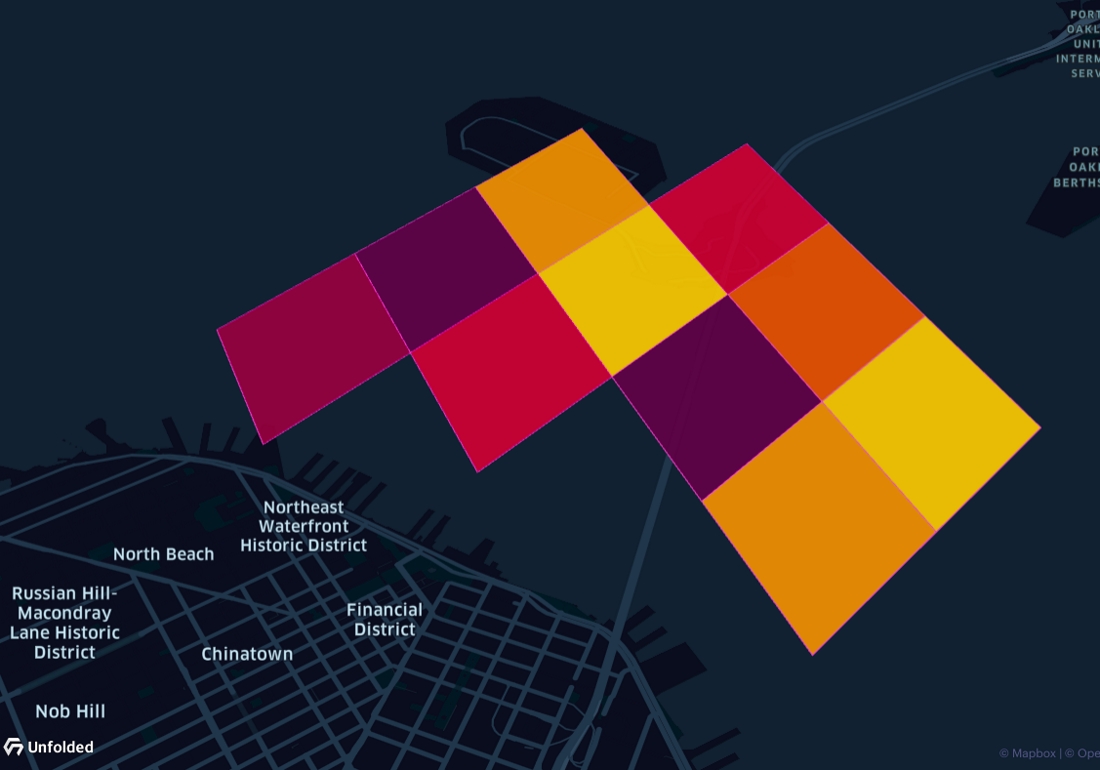 |
Trip Layer | Visualize movement through animations, such as air travel over a period of time | 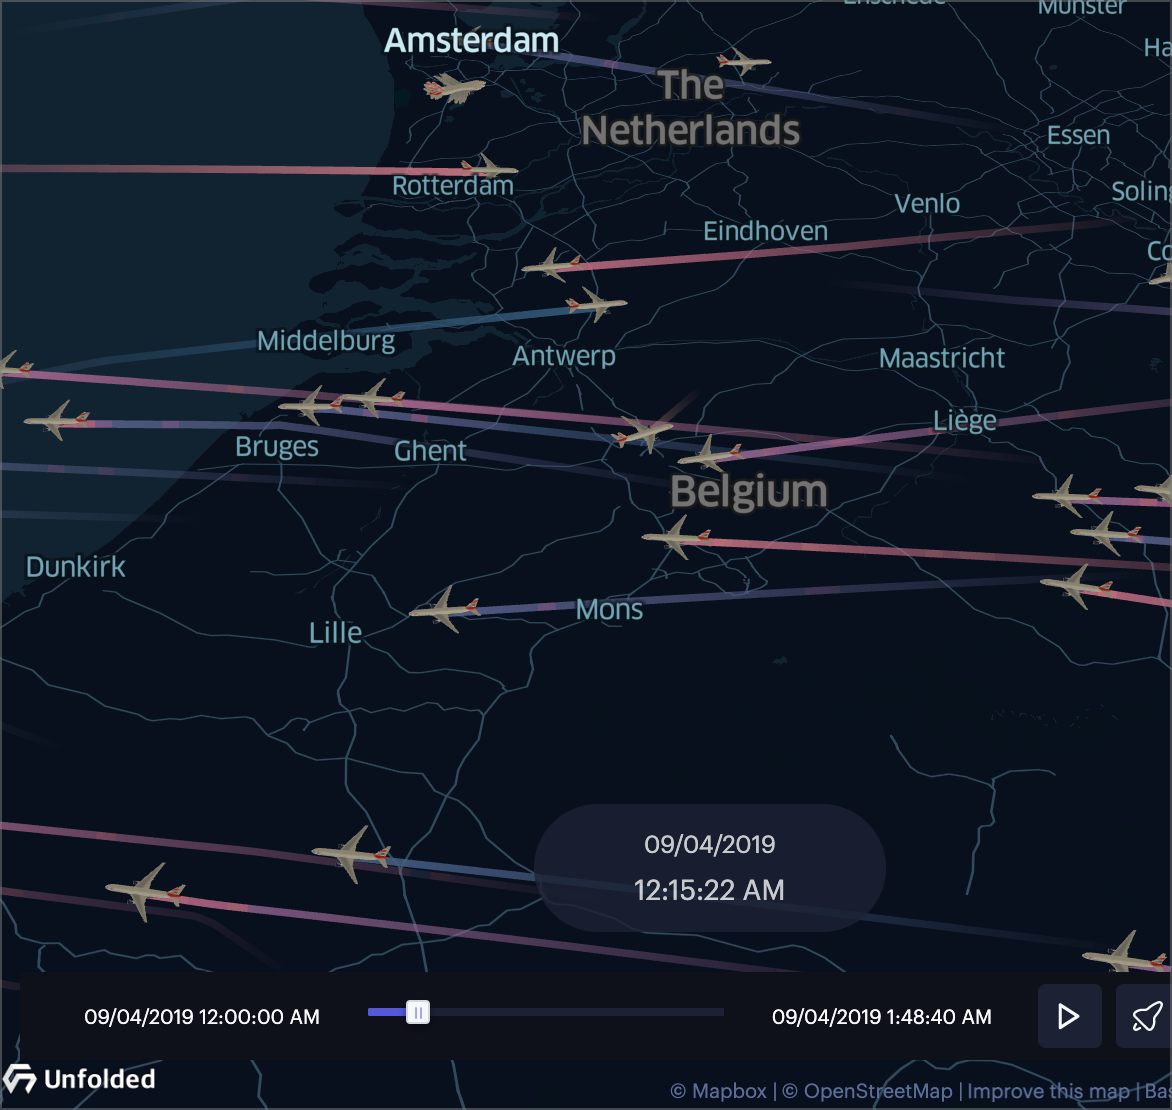 |
Vector Layer | Vector layers use the three basic GIS features to represent real-world features in digital format. | 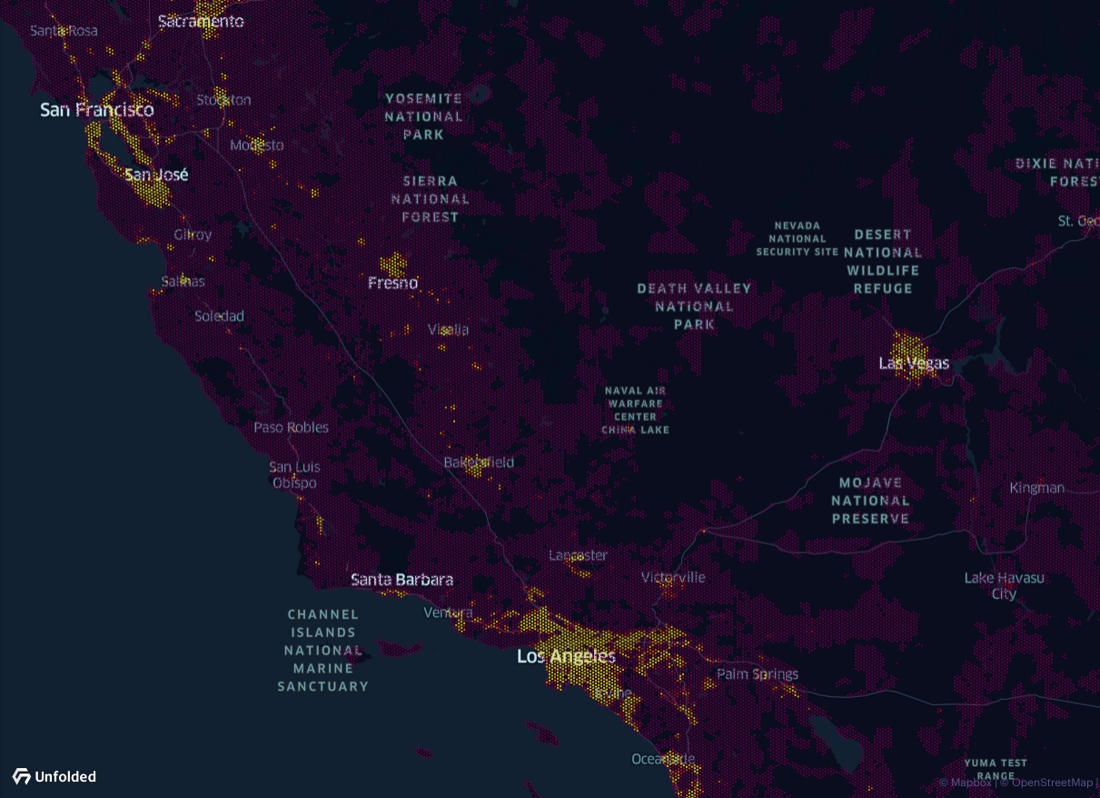 |
WMS Layer | WMS layers render map imagery optimized for the current viewport. | 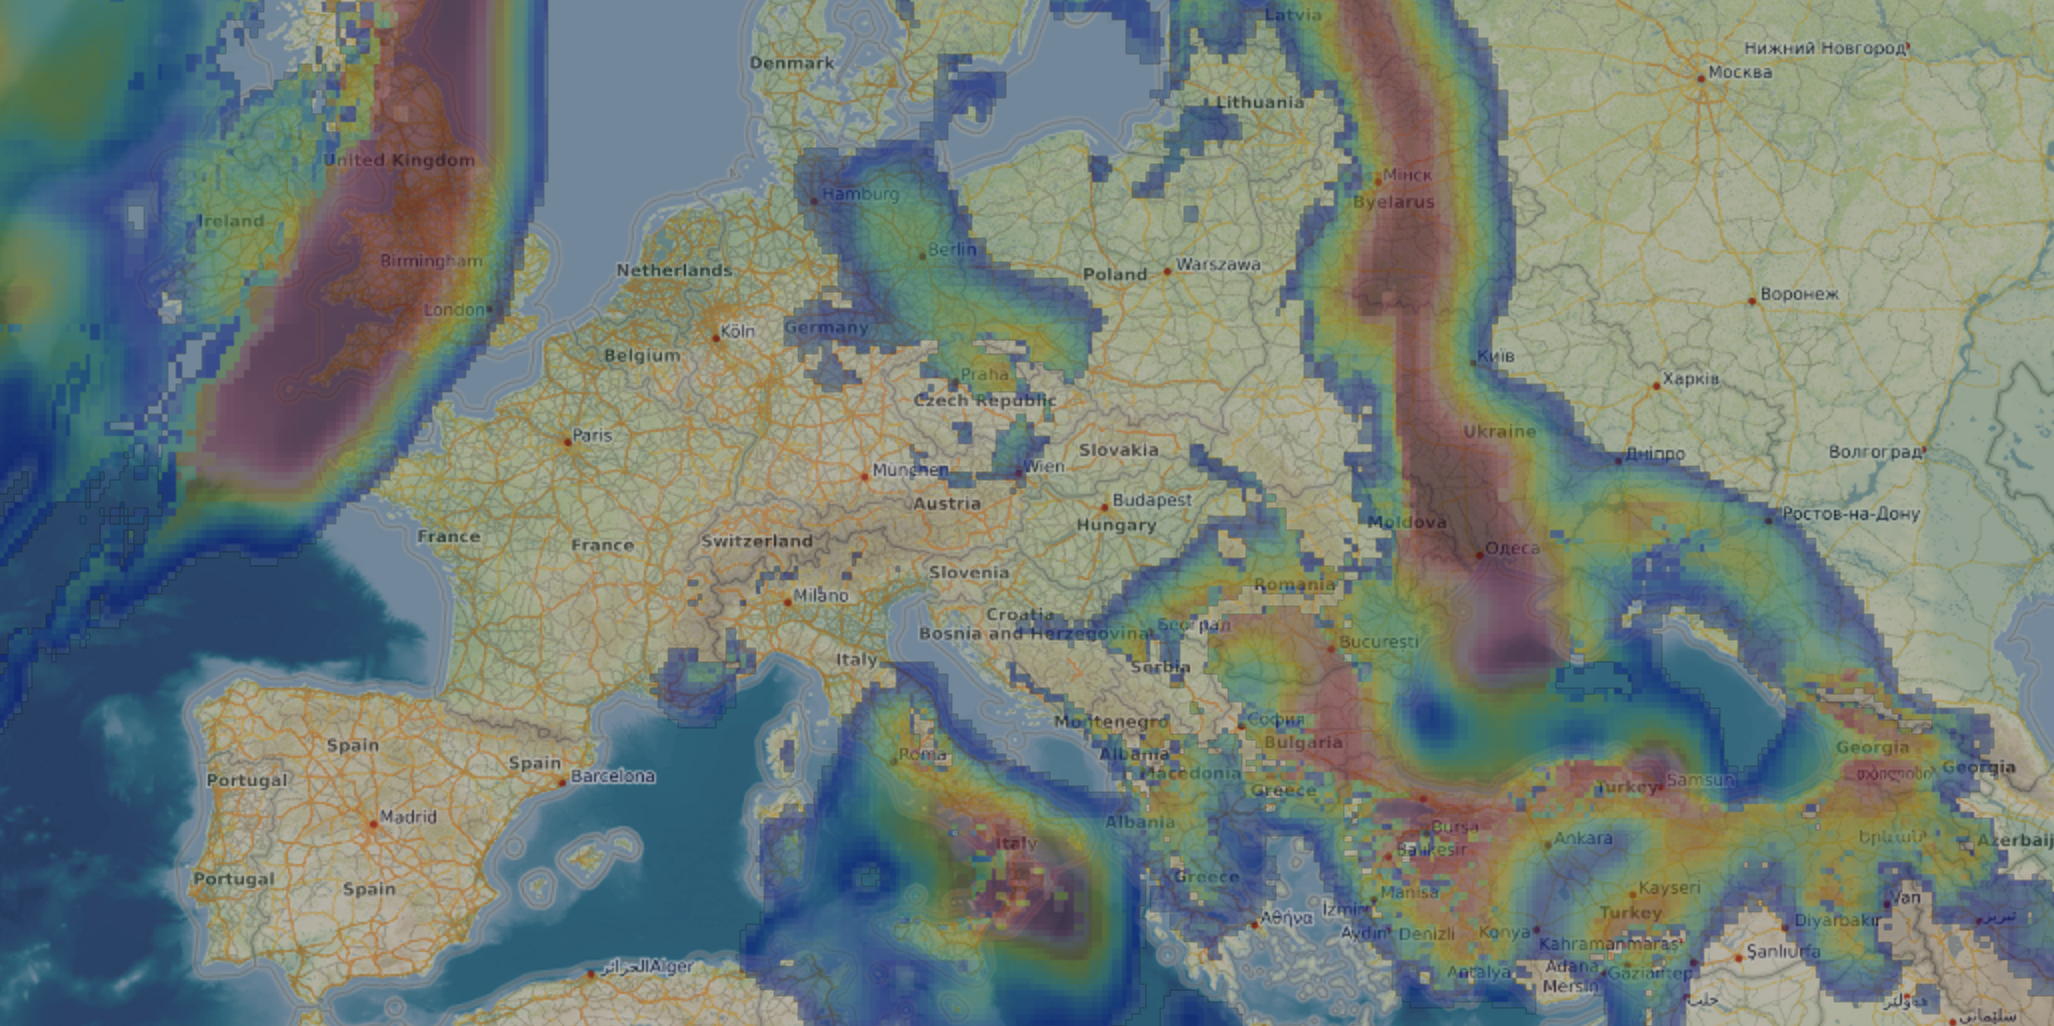 |
Updated 6 months ago
Did this page help you?