
Shapify
The Shapify feature lets you work with datasets that contain identifiers for well-known administrative boundaries (such as ZIP codes or census tracts).
When you load a dataset that has columns with supported identifiers, you can immediately visualize boundaries on your map, even when your data does not contain any explicit geospatial geometry.
Auto Shapify
Studio will automatically recognize columns that can be shaped into geospatial points on the map.
When you load a compatible dataset, simply click Shapify to automatically run the Shapify operation.
You can click the checkbox next to each geometry feature to enable/disable Shapify processing. In addition, you may change the geometry type to be applied during Shapify.
| Geometry Type | Description |
|---|---|
| Boundary | Creates a polygon representing the boundary of the region. |
| Centroid | Creates a point representing the centroid of the region. |
Manual Shapify
To manually apply Shapify, follow these steps:
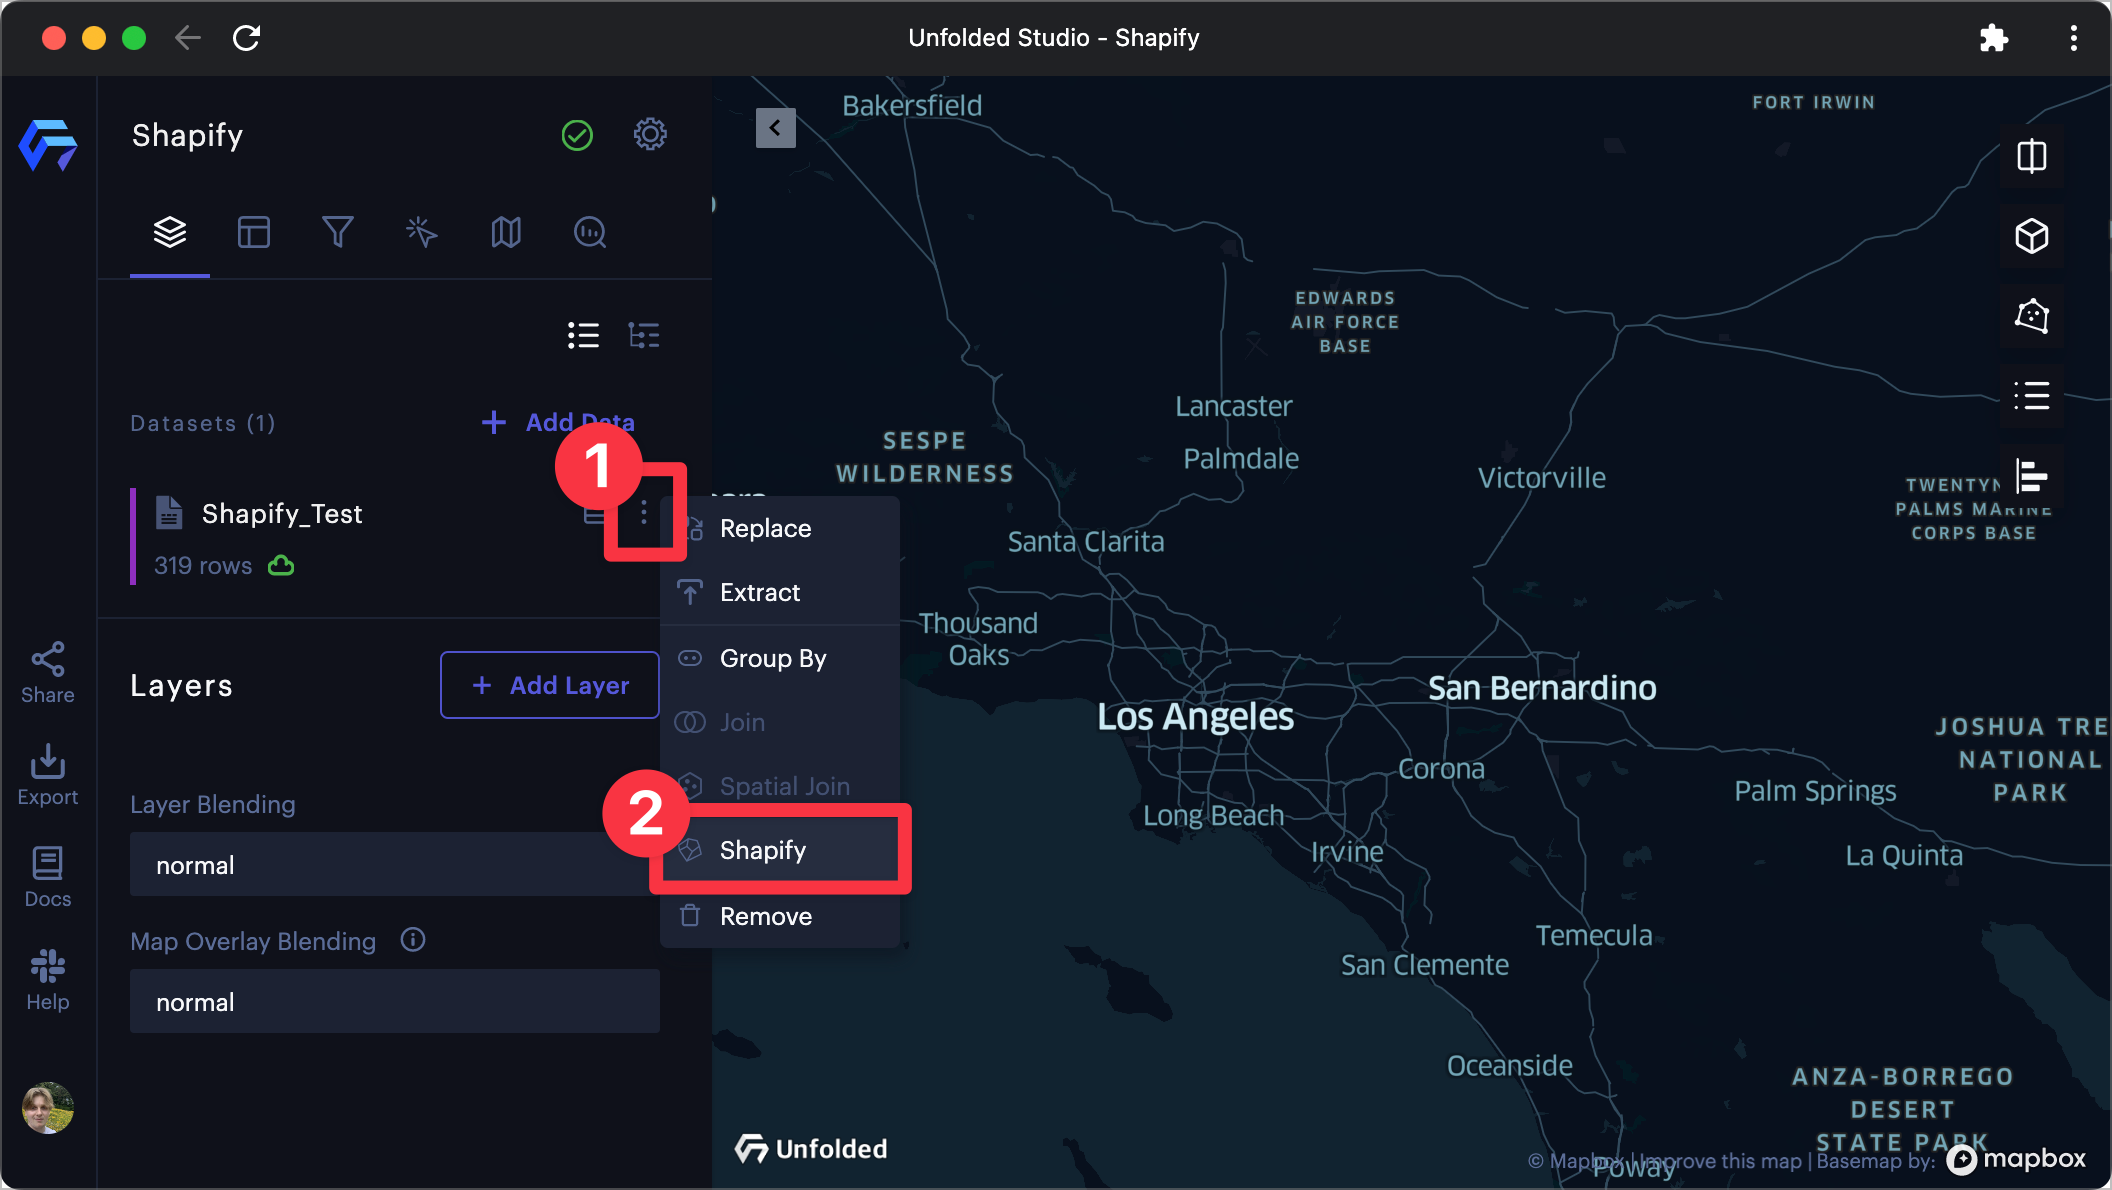
1. On the dataset you wish to Shapify, click ⋮ More Options >> Shapify.
The Shapify option on a dataset object.
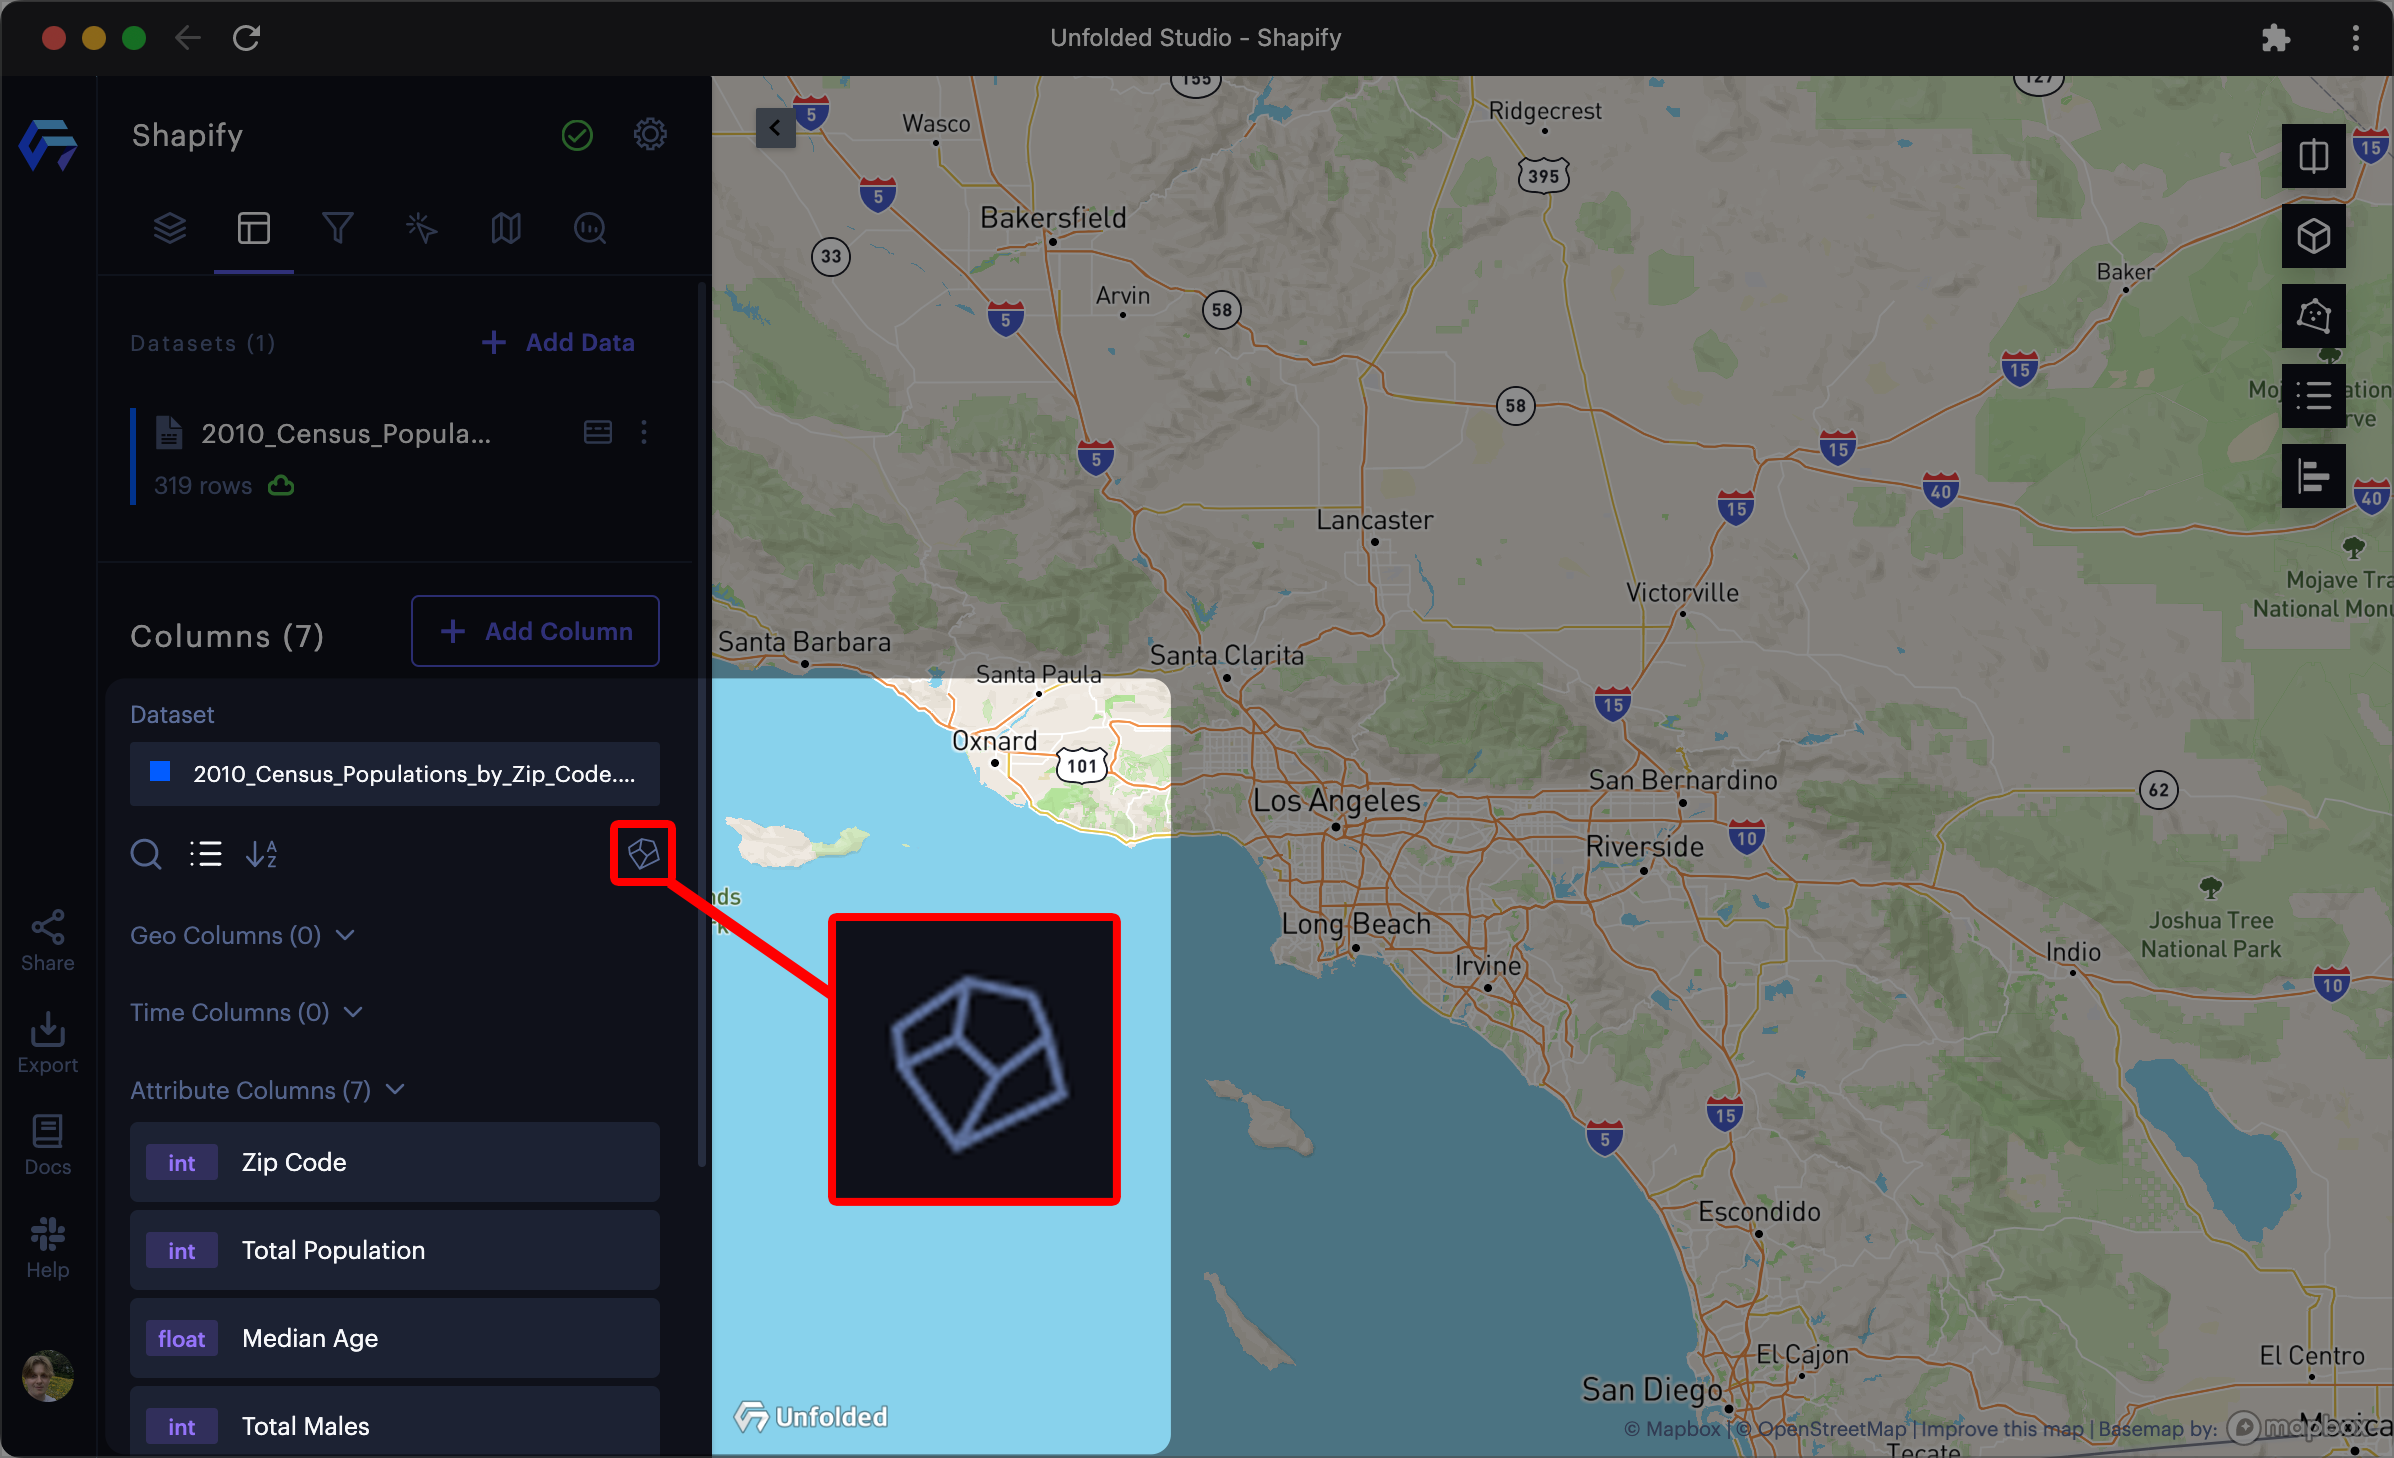
Alternatively, navigate to the Columns tab, then click the Shapify button.
The Shapify button in the Columns tab.
2. Click Select a field, then select any valid columns and select the type of boundary and geometry.
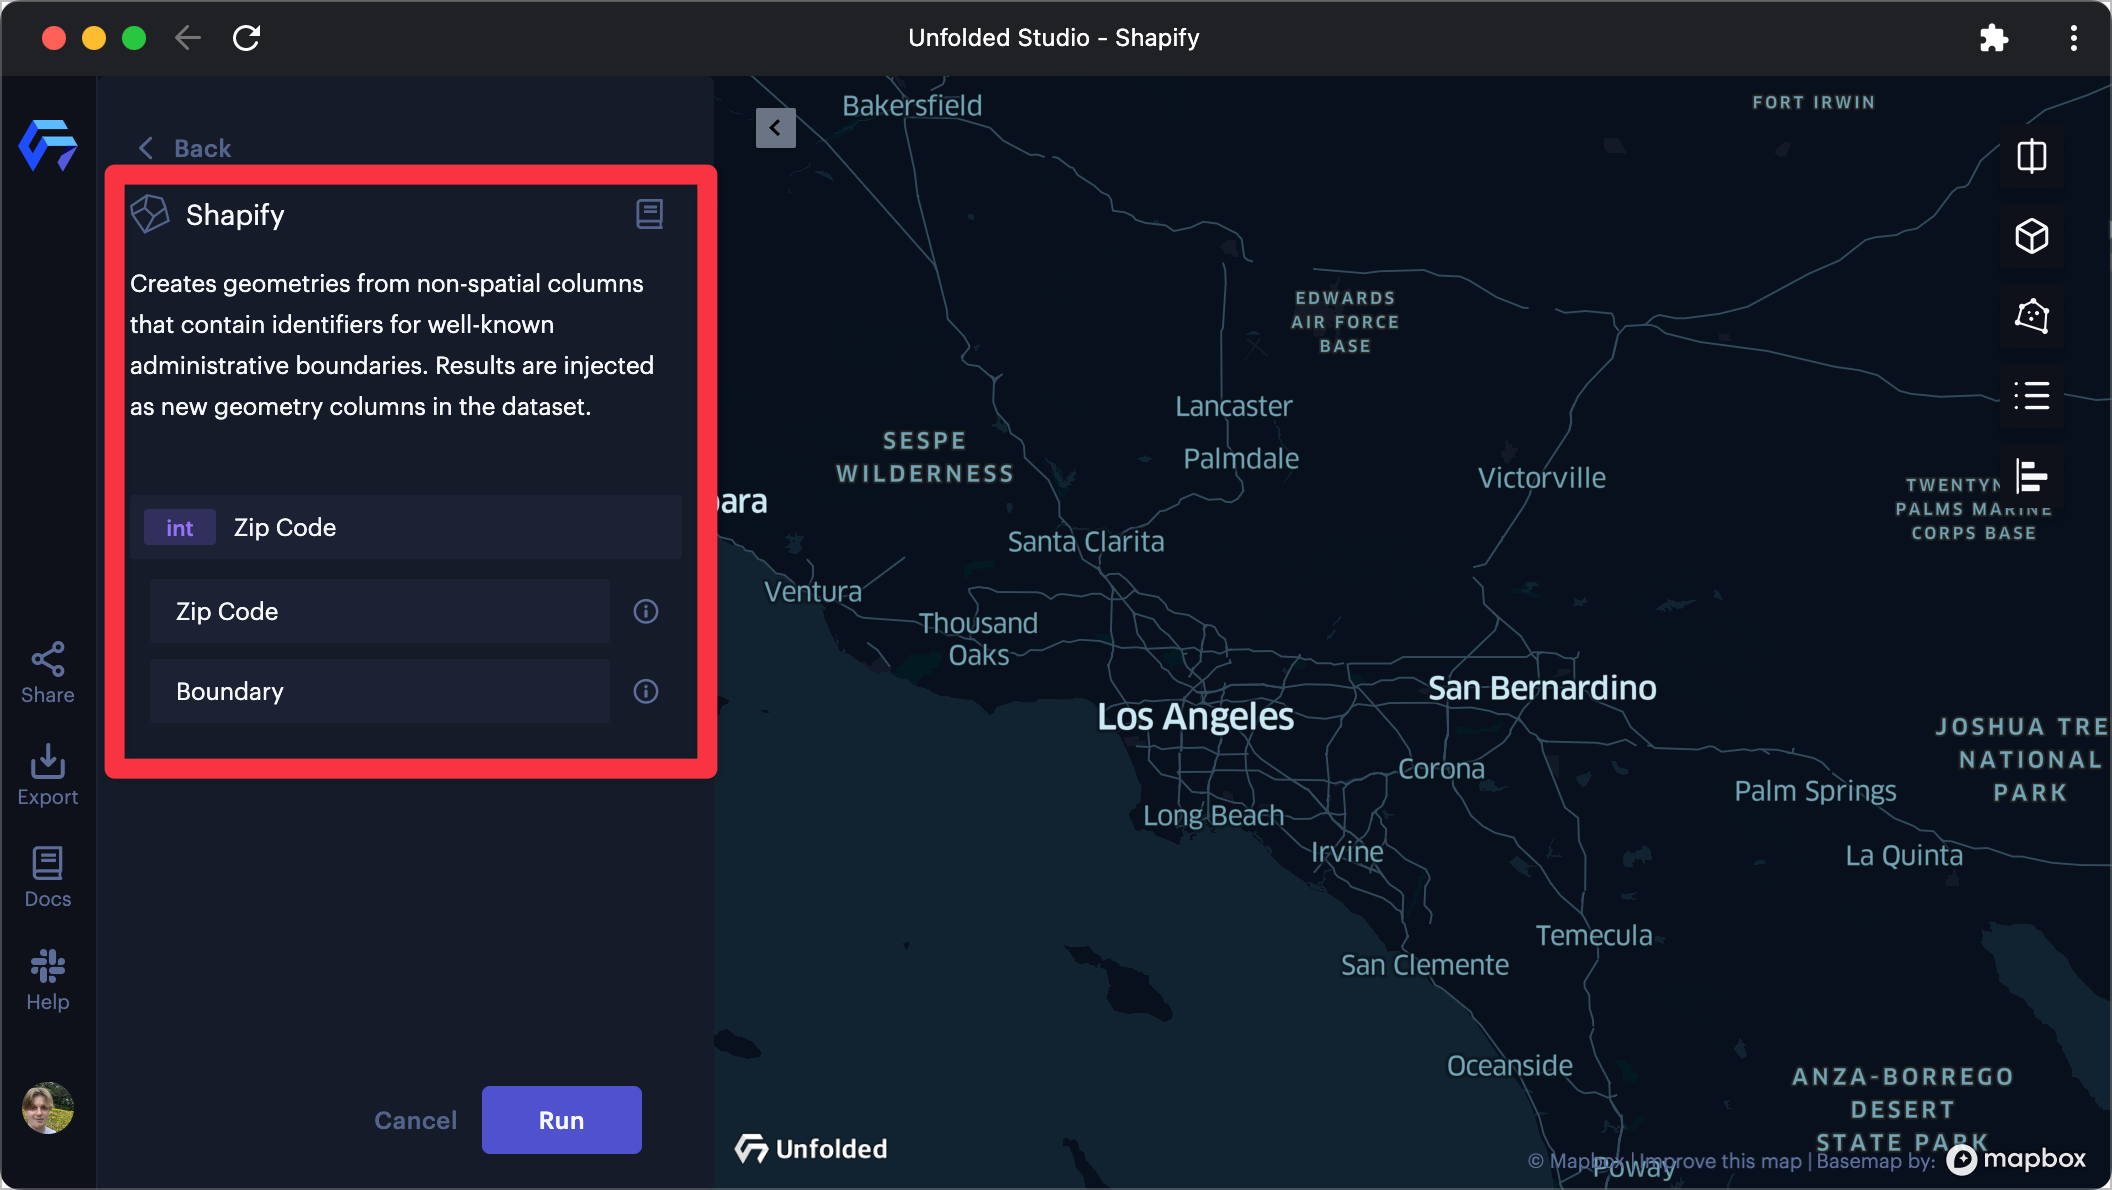
Manually applying Shapify to a map with a ZIP code column.
3. Click Run to complete the Shapify operation.
Once complete, Studio will provide a message indicating the number of geometry columns created by the Shapify operation along with a list of their names.
Each column generated by this process will appear with a Shapify badge in the Geo Columns section.
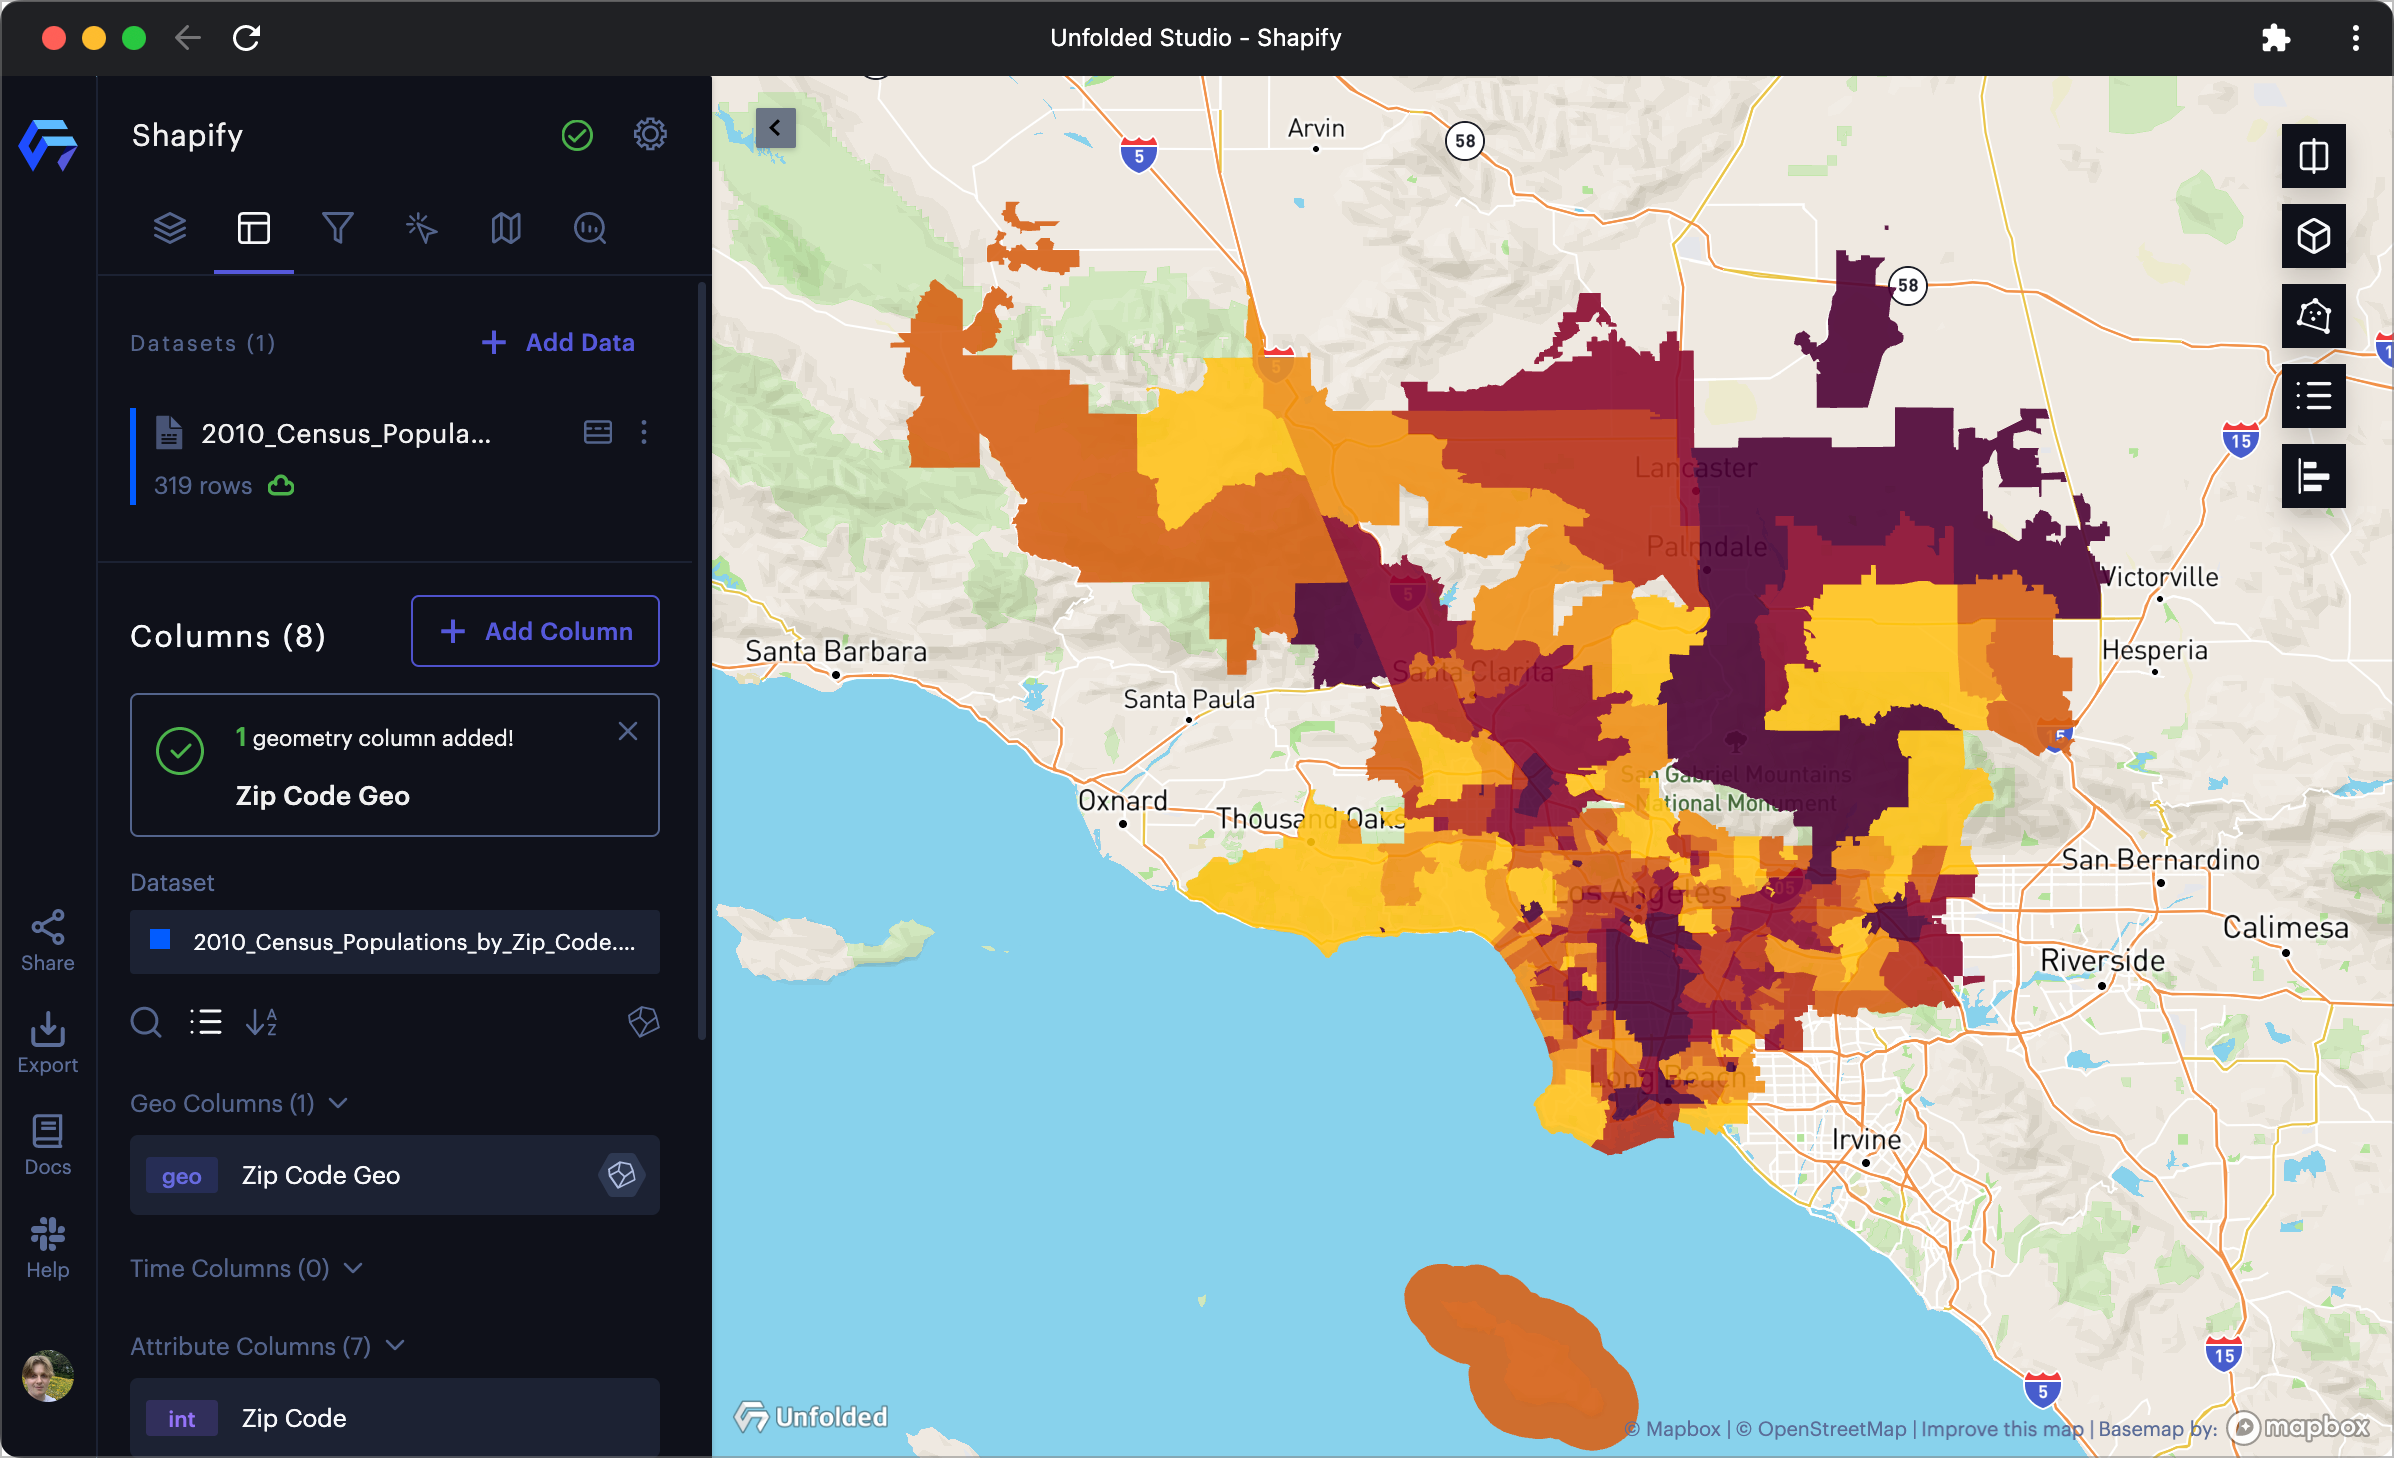
The new ZIP code polygon layer after a Shapify operation.
Supported Admin Boundaries
For best results, columns should contain admin boundaries with their corresponding GEOID. Please visit the census.gov GEOID structure reference to learn more.
| Boundary | Detect Prefixes | Example | Description |
|---|---|---|---|
| US State | state | 06, 41, CA, Washington | US State names or GEOID identifier. |
| US County | county | 06111 | US county GEOID identifiers. |
| US ZIP Codes | postal, zip, zcta | 90210 | 5-digit US postal codes. |
| US Census Tracts | census,ct,tract | 48201223100 | Large census areas roughly covering a city or town, common in demographics datasets (age, income etc). |
| US Census Block Groups | bg,blkgrp | 482012231001 | Medium census areas, typically grouping 300-6000 people. |
| Other Identifiers | geo_id,geoid,gid,fips,elsdlea,unsdlea,scsdlea,placefp,pumace | - | Various other identifiers detected by Studio's Shapify operation. |
Studio currently supports the most common US admin boundaries. The catalog of supported admin boundaries is being built out based on customer needs, please contact us at [email protected].
Working with Other Admin Boundaries
If you need to work with admin boundaries that are not yet supported by Shapify, and you have a dataset with id and geometry columns, you can add the dataset in Studio and join it with your primary dataset.
You may also combine attributes of multiple datasets based on their spatial relationship with the spatial join feature.