Group By
Use Group By to combine and aggregate data based on a selected field. The results of the operation are added to the project as a newly derived dataset.
Potential use cases for group by operations include:
- Computing the average air quality statistics of a static location over a period of time.
- Retrieving the total count of a specific feature on the map.
- Calculating the distribution of a COVID-19 outbreak for any given region.
Run a Group By Operation
Follow these steps to run a group by operation in Studio:
- Navigate to the Columns tab.
- Click ⋮ More Options >> Group By on the column to base the group by operation on.
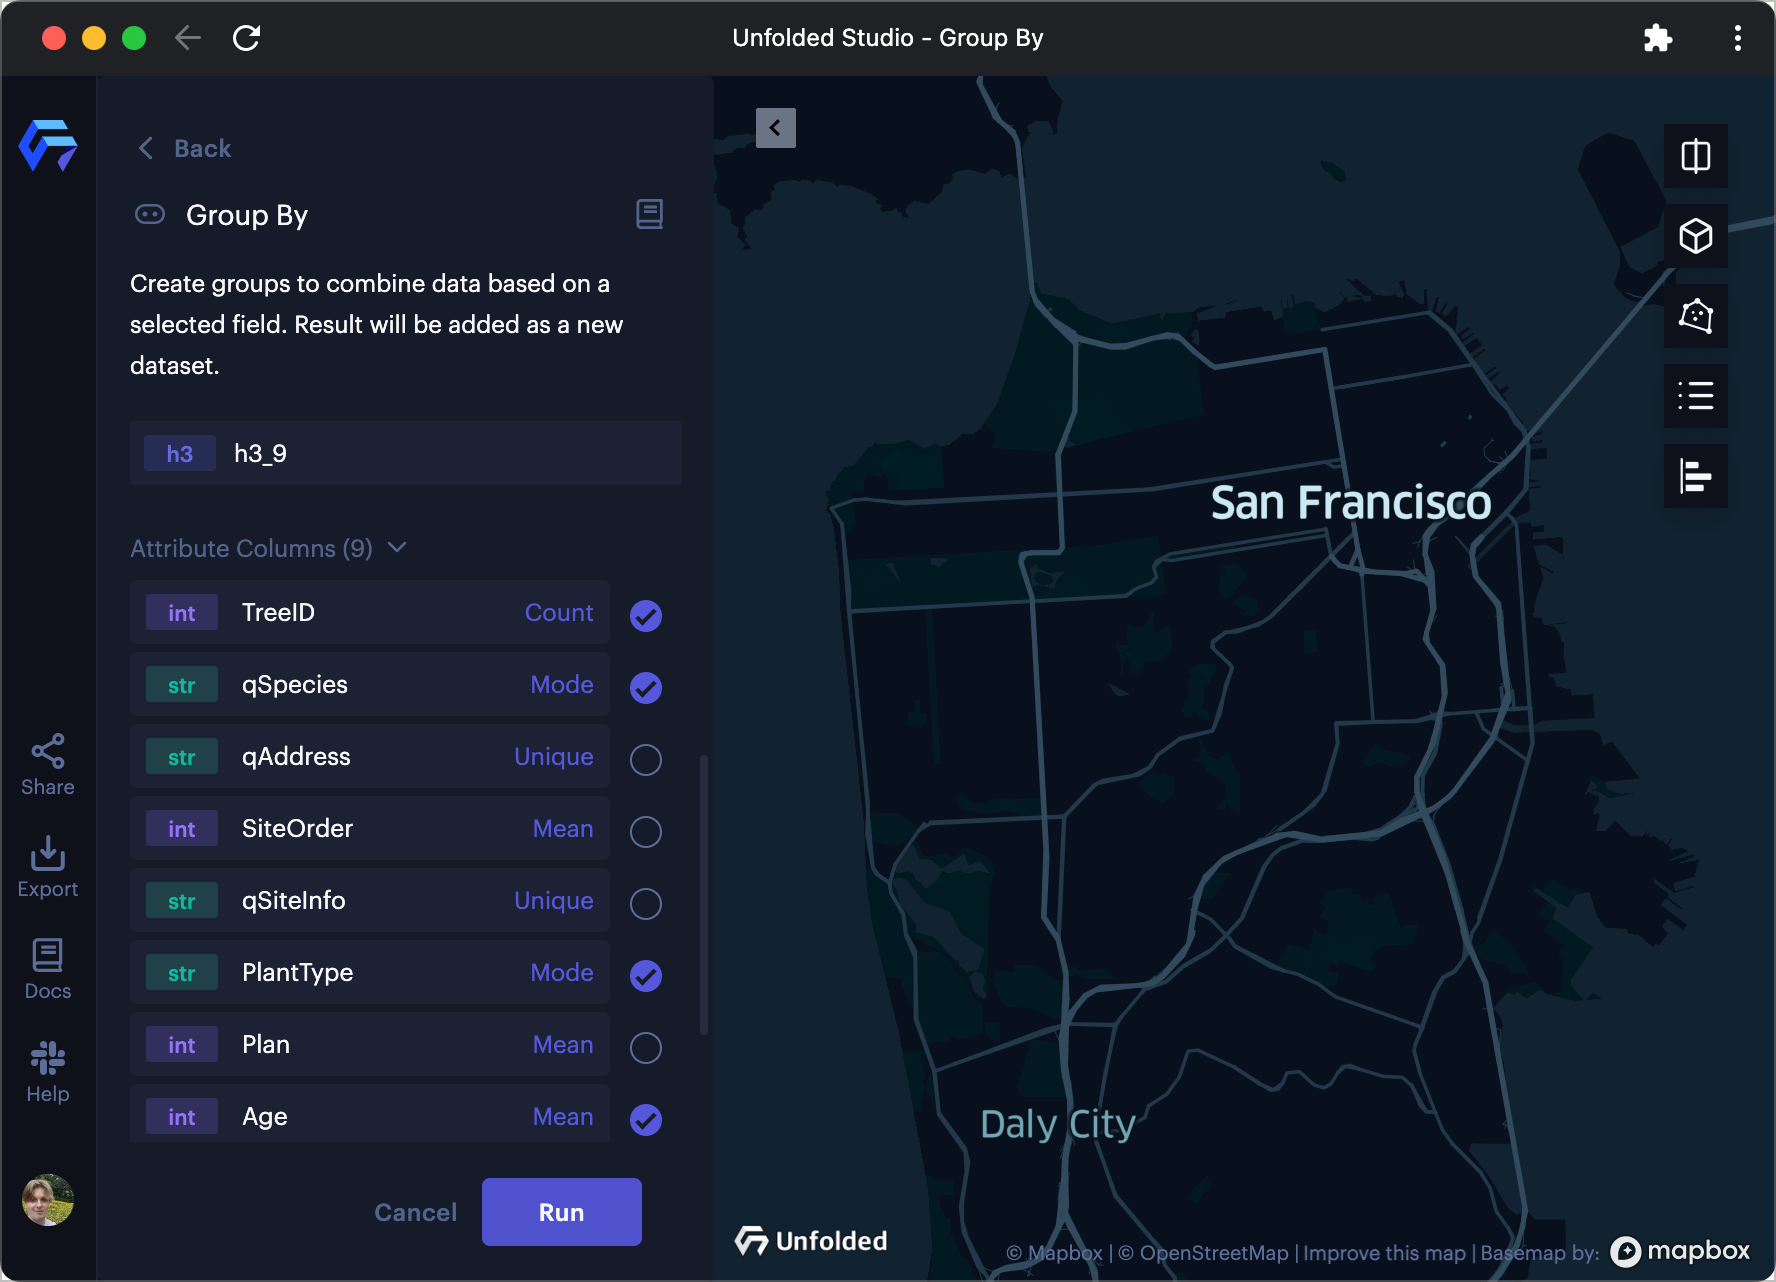
The selected column for the group by operation will appear at the top of the Group By panel. Click the selected column to choose a new column for the group by operation.
In this example, a dataset containing trees in San Francisco is grouped by h3_9, a column containing H3 index strings.
- Define aggregation rules for the group by operation.
A panel appears with fields to define the aggregation rules for combining data in each column.
First, select/unselect fields to include/exclude in the grouped dataset. If your dataset contains many columns you wish to remove, click Unselect all and then select only the columns you wish to include.
Next, change the aggregation methods for any column by clicking the purple aggregation text. Based on the data type of each column, Studio will provide a list of all applicable aggregation methods.

Defining aggregation methods for the Group By.
- Click Run to run the group by operation.
A window will appear containing a preview of the grouped dataset. If you notice any issues with the grouped dataset, alter the aggregation rules then click Rerun.
- Click Confirm to add the grouped dataset to the project.
The grouped dataset will appear connected to the source dataset. Studio may also automatically generate a new layer for the grouped dataset. You may start configuring this dataset to visualize the newly aggregated data.
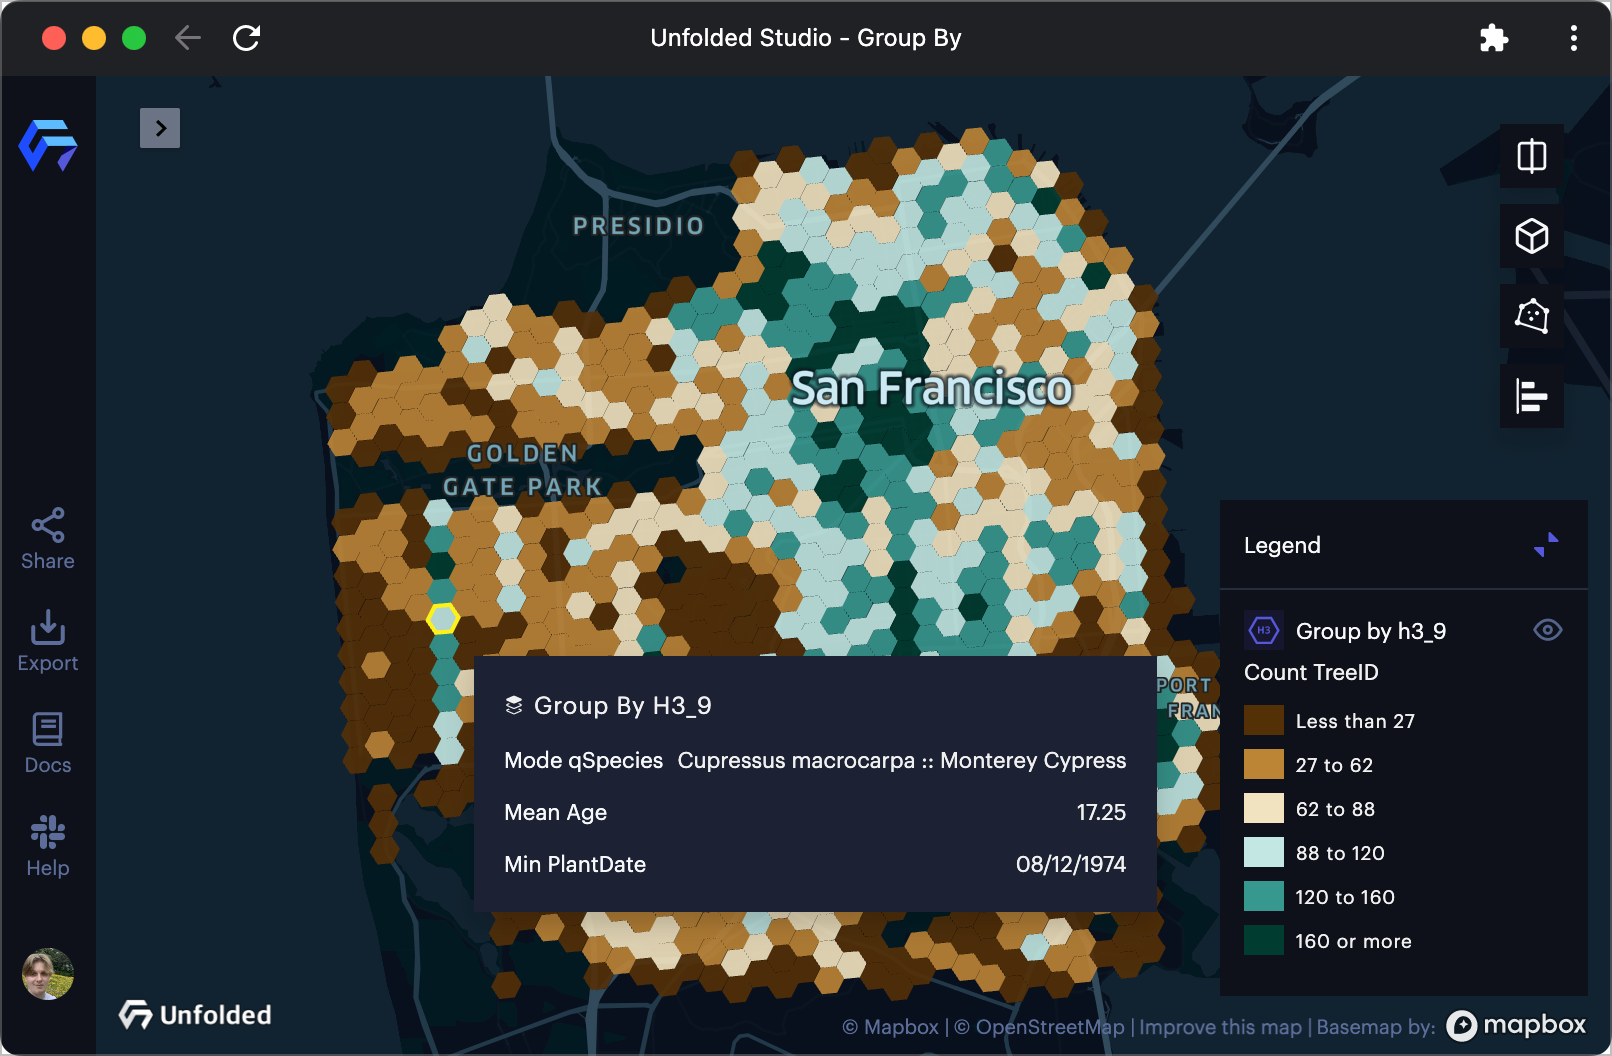
In the example below, the newly aggregated count TreeID column visualizes the distribution of street trees throughout San Francisco in H3 cells at resolution 9. Green areas represent areas with more street trees, while brown areas represent areas with fewer street trees. The tooltip may also contain any field from the grouped dataset.

SF Tree data bucketed into H3 cells, colored by count.
Available Group By Operations
Refer to the table below to see the supported aggregation options based on the data type of the columns in your dataset.
| Data Types | ||||||
| Aggregation Method | Numerical | Time | Categorical (String) | Boolean | Geometry | H3 |
| COUNT | ✔️ | ✔️ | ✔️ | ✔️ | ✔️ | |
| SUM | ✔️ | |||||
| MEAN | ✔️ | |||||
| MAX | ✔️ | ✔️ | ||||
| MIN | ✔️ | ✔️ | ||||
| DEVIATION | ✔️ | |||||
| VARIANCE | ✔️ | |||||
| PERCENTILE (05, 25, 50, 75, 95) | ✔️ | |||||
| MODE | ✔️ | ✔️ | ✔️ | ✔️ | ||
| UNIQUE | ✔️ | ✔️ | ✔️ | |||
| MERGE | ✔️ | ✔️ | ||||
Spatial Merge
Use spatial merge with geojson or h3 data to dissolve borders or otherwise combine geometries based on a common field. When merging geojson data, all polygons, LineStrings, Points, and other features will be merged. When merging h3 data, all h3 indexes that share the field will be merged.
Follow these steps to complete a spatial merge:
- Start a new group by operation, then select a field shared by the geometries you wish to merge.
- Choose any other columns you wish to include in the group-by operation.
- Select the
Mergeaggregation option for yourpolygonorh3column.
Upon competing the group by operation, a new dataset will appear with your merged spatial objects.
Example
In the above example, a dataset containing election data is loaded into Studio. This election data has the column _geojson, which contains GeoJSON MultiPolygon objects representing congressional districts, as well as a column PARTY_LEADING, indicating which party controls the congressional district.
To view the number of congressional districts controlled by an individual party, we run a group by operation on the STATENAME field. Then, we choose the Merge aggregation option on our _geojson column and Mode on our PARTY_LEADING column.
Upon completing the merge, a new layer is automatically generated with the new Merge _geojson column. We can quickly configure this layer to display the data calculated by the group by operation. In this case, we alter the color scale to have just two steps, then select the new Mode PARTY_LEADING column to fill the polygons. This map now shows the party that controls the most congressional districts in each US state.
Grouped Dataset Storage
The derived datasets created via group by operations are loaded with the project and are not automatically saved to your Studio dataset cloud storage.
If you wish to use a grouped dataset in other projects, use Studio's Extract feature.
Updated about 2 years ago
