
Python best practices
This page contains some of the best practices when working with Map SDK in a Python environment, that make it easier to iterate quickly and have a good developer experience.
Importing
Since Map SDK 3.0 we made it possible to access all of the things that you may need by only importing the root module, instead of importing them all separately.
import foursquare.map_sdk as map_sdk

map_sdk.create_map()
map_sdk.PointLayer()
map_sdk.Animation()
# ...
This helps you save time trying to figure out which exact submodules you need to import for each of the things that you want to use, and instead, just locate all of it easily using a single import.
Using specialized classes for a better DX
We strongly recommend using specialized classes to construct complex objects, instead of dealing with dicts. While both are possible and will end up having the exact same behavior, the former gives you a much better developer experience by providing: auto-complete, type hints and docstrings, which can help you along the way.
import foursquare.map_sdk as map_sdk

# prefer using utility classes when constructing complex objects
map.add_dataset(map_sdk.LocalDatasetCreationProps(
    label="My dataset",
    data=earthquakes_dataframe
))

# you still can use plain Dicts, but the DX is less great
map.add_dataset({
    "type": "local",
    "label": "My dataset (from a dict)",
    "data": earthquakes_dataframe
})
By using specialized classes, you are able to access their docstrings very easily (by hovering with a mouse, in most IDEs):
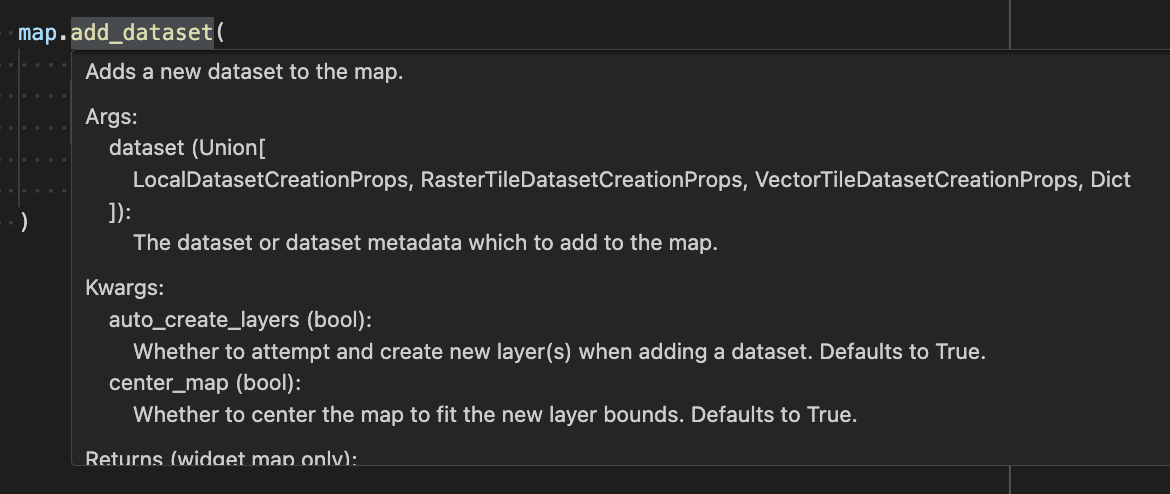
In most IDEs, you can also Cmd/Ctrl + click to execute a "Go To Definition" and reveal the full details and the implementation of a specific class or method.
Using JSON config editors
To make it easy to iterate over the design and the exact state of the map, you can use JSON config editors in combination with the Map SDK.
JSON config editors make it possible for you to retrieve the exact JSON configuration of a specific part of the map state that you've made through the UI, and then copy-paste it into the Map SDK directly.
Each of the JSON editors that exists in the UI has a corresponding function in the Map SDK that you can use. There are the following Map SDK functions: add_layer_from_config(), set_map_config(), set_view_from_config(), add_filter_from_config() and set_animation_from_config().
Example
Putting all of this together, this is what your code might look like:
import pandas
import foursquare.map_sdk as map_sdk # using a single named import

# 1. create a map
map = map_sdk.create_map(
    api_key="...YOUR API KEY HERE..."
)

# 2. create a dataset and add it to the map
earthquakes_dataframe = pandas.read_csv("https://4sq-studio-public.s3.us-west-2.amazonaws.com/sdk/examples/sample-data/earthquakes.csv")
DATASET_ID = "earthquake-data"

map.add_dataset(
    # we can use the classes to construct specialized objects, instead of dicts
    dataset=map_sdk.LocalDatasetCreationProps(
        id=DATASET_ID,
        label="Earthquakes",
        # raw data (supports CSV (str), Lists, DataFrame or GeoDataFrame)
        data=earthquakes_dataframe,
    ),
    # we will skip automatic layer creation, and will instead make a layer by ourselves
    auto_create_layers=False
)

# 3. create a layer and add it to the map
# we can use the specialized layer type classes to construct layers
point_layer = map_sdk.PointLayer(
    label="Earthquakes layer",
    # a dataset to use
    data_id=DATASET_ID,
    # specify how to map data columns to layer properties (geometry and appearance)
    columns=map_sdk.PointLayerNeighborsColumns(
        lat="Latitude",
        lng="Longitude"
    ),
    size_column="Magnitude",
    color_column="Magnitude",
    # (optional) customizing the visual appearance
    color_range=map_sdk.ColorRange(
        colors=["#4C0035", "#880030", "#B72F15", "#D6610A", "#EF9100", "#FFC300"],
    )
)

map.add_layer_from_config(point_layer.to_json())

# 4. adjust the map view(port)
map.set_view(map_sdk.PartialView(
  latitude=38.0200813,
  longitude=-122.1537049,
  zoom=5.620450308396572,
))

# 5. display the map
map # or `display(map)`
Updated 6 months ago