
Relative Performance Metrics
As a policy, Foursquare does not share report metrics between distinct Media Partners participating in the same campaign. However, we understand that the ability to compare outcomes is important to contextualizing performance and making decisions.
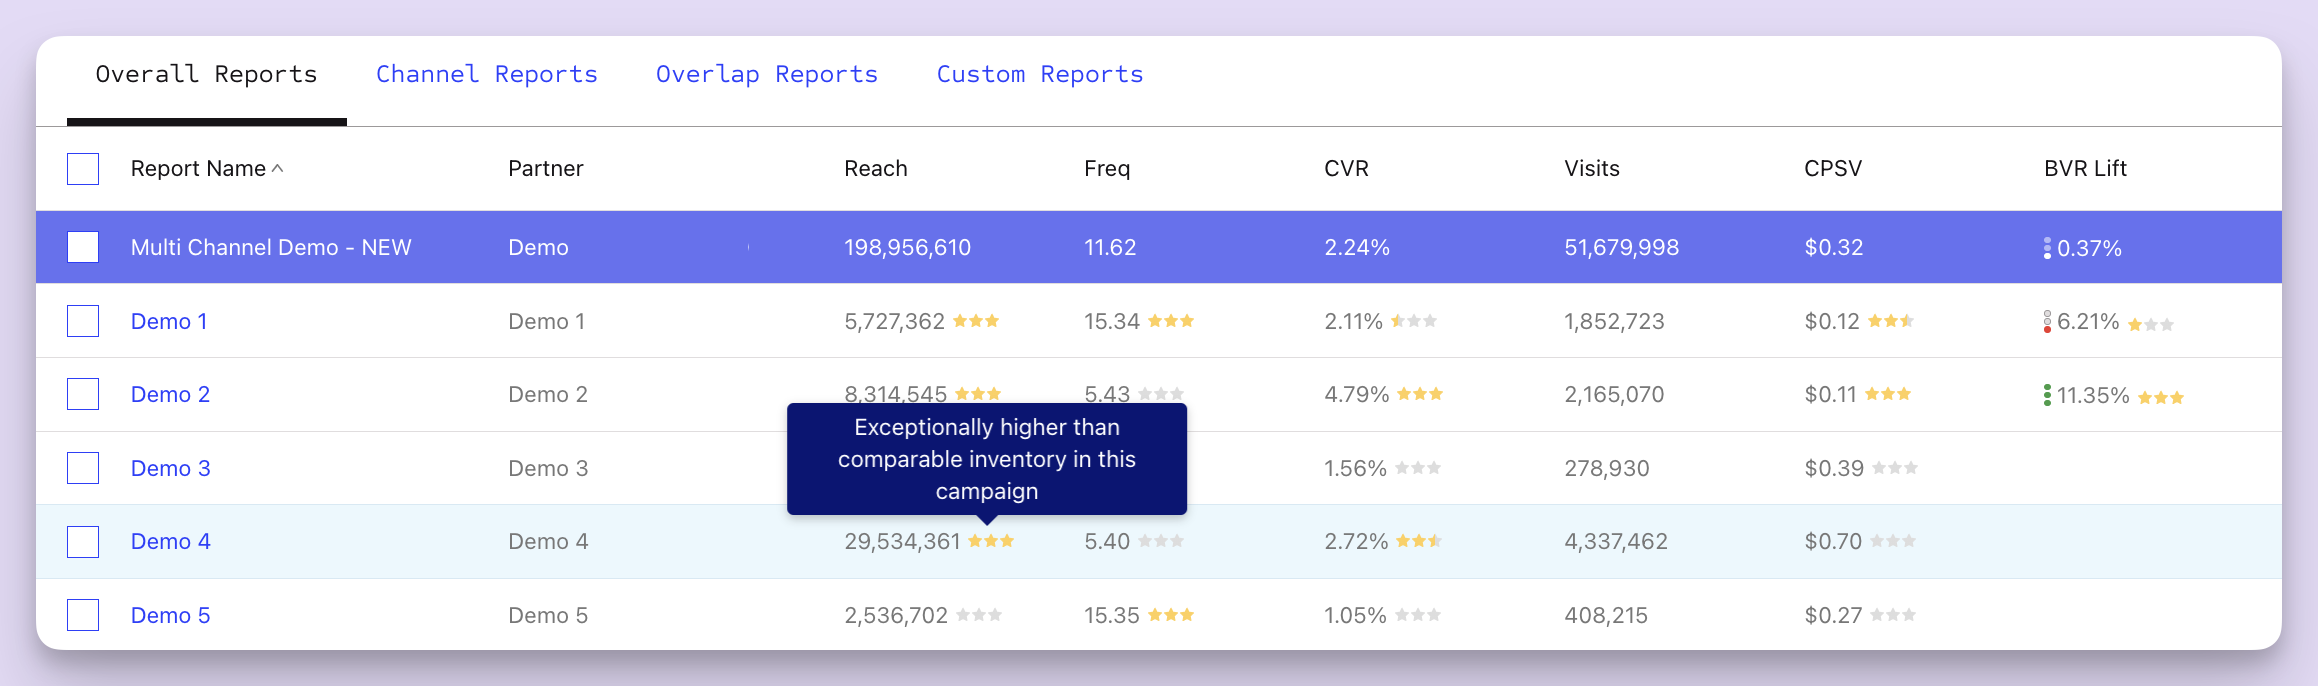
Screenshot of relative performance metrics from a set of reports.
Providing this insight is the purpose behind Relative Performance Metrics (RPMs) featured on your campaign's overview page. RPMs give Partners visibility into how their media is performing relative to comparable inventory from other partners on the campaign, including:
- Reach
- Frequency
- Conversion Rate (CVR)
- Cost per Store Visit (CPSV)
- Behavioral Lift
How it Works
Foursquare Attribution offers reporting by standardized Media Channels, which separates channel inventory by Media Type (e.g., Traditional vs. Digital). To calculate relative performance, your media delivery is compared to the average for all inventory within the Media Type.
Example Scenario
There are 4 Partners who delivered media for the same campaign. Each partner delivered an equal volume of impressions at a different frequency:
- Partner A reported a Frequency of 1.0 for Digital: Search inventory
- Partner B reported a Frequency of 4.0 for Digital: Display inventory
- Partner C reported a Frequency of 5.0 for Digital: Online Video inventory
- Partner C reported a Frequency of 5.0 for Digital: Online Video inventory
In this scenario, the average Frequency for Digital inventory is ~3.3. Therefore, Partner B's relative performance is calculated as follows:
(4.0 – 3.3) ÷ 3.3 = 21.2%
In other words, Partner B's Frequency in this campaign was 21.2% higher than comparable inventory.
Note:It is possible that a single Partner can deliver both Traditional and Digital media within the same campaign. Where applicable, this is taken into account for calculating relative performance.
The Rating System
For the metrics mentioned above, a star-based rating system offers an at-a-glance view into relative performance. At this time, relative performance is only accessible via your campaign's overview page.
Note that the messaging and associated visuals may not represent the actual UI
Using your mouse to hover over the ratings will activate a tooltip, offering a more detailed description for the rating. The possible outcomes are outlined below. While we cannot offer a direct view into the calculation, the descriptive text attempts to offer a sense of direction and ranking.
For metrics that are below average compared to the broader Media Type (ascending):
- Exceptionally lower than comparable inventory in this campaign
- Significantly lower than comparable inventory in this campaign
- Modestly lower than comparable inventory in this campaign
- Slightly lower than comparable inventory in this campaign
For metrics that are above average compared to the broader Media Type (ascending):
- Slightly higher than comparable inventory in this campaign
- Modestly higher than comparable inventory in this campaign
- Significantly higher than comparable inventory in this campaign
- Exceptionally higher than comparable inventory in this campaign
Updated 5 months ago